Solana Drops Towards $40, Here’s The Next Major Support (SOL Price Analysis)
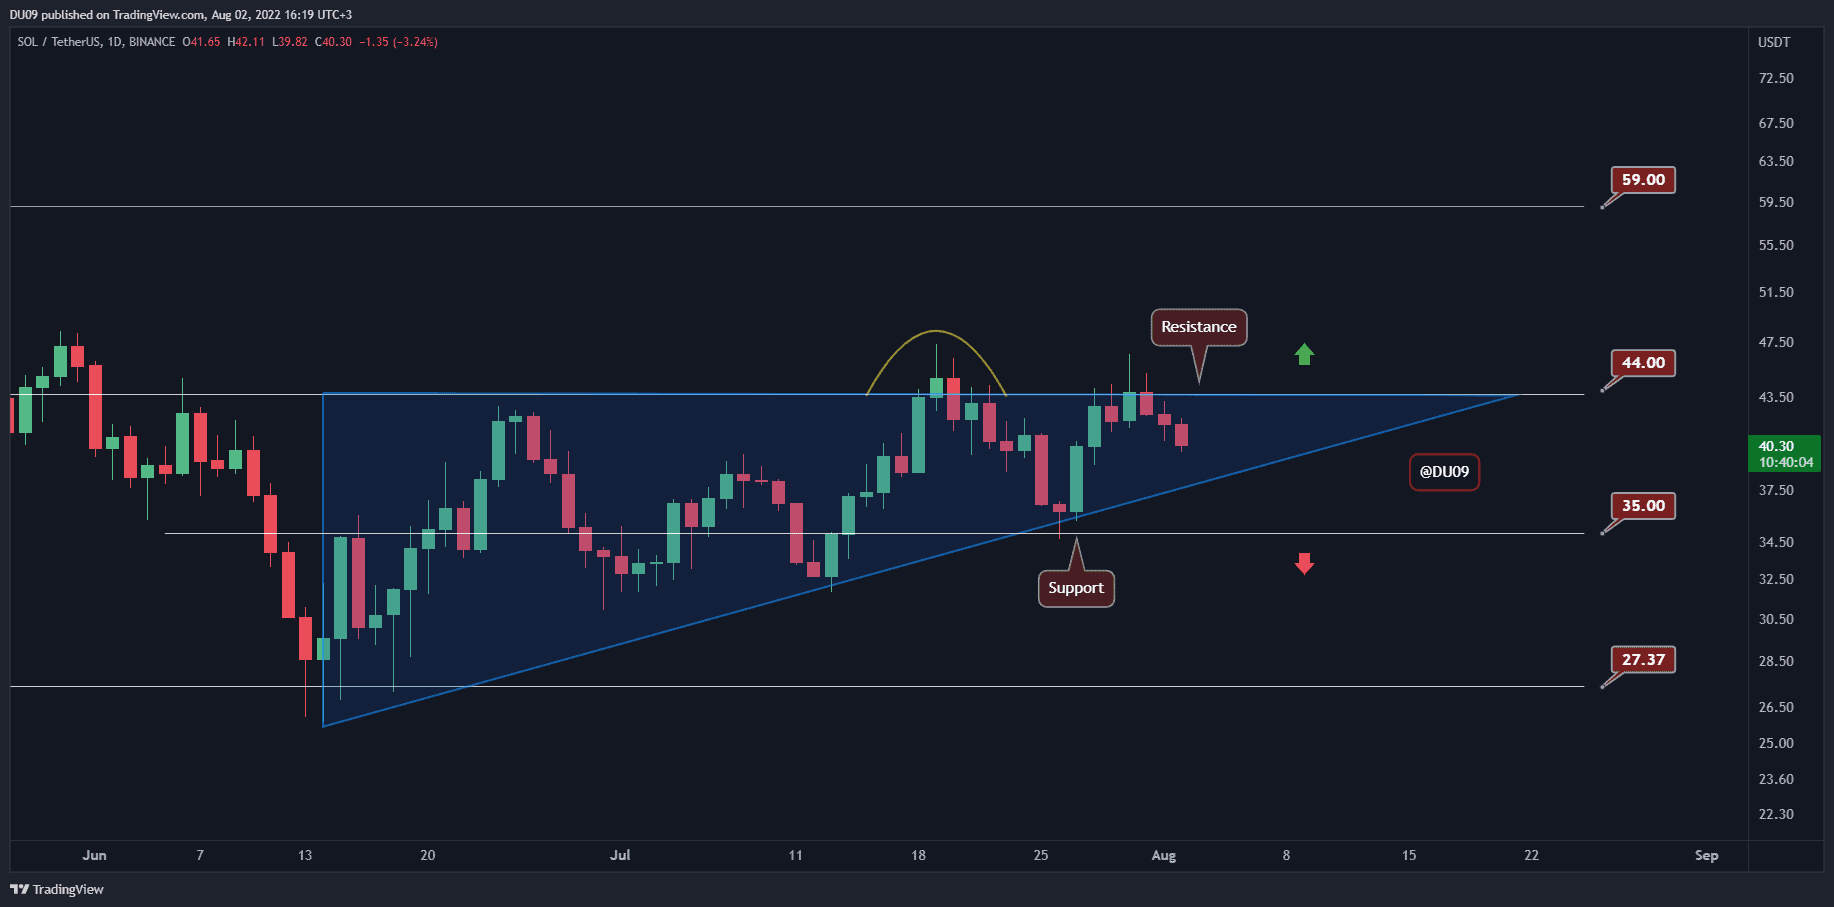
Solana had a good attempt at escaping from its ascending triangle but failed. Now the price is approaching the key support.
Key Support levels: $35, $27
Key Resistance levels: $44, $59
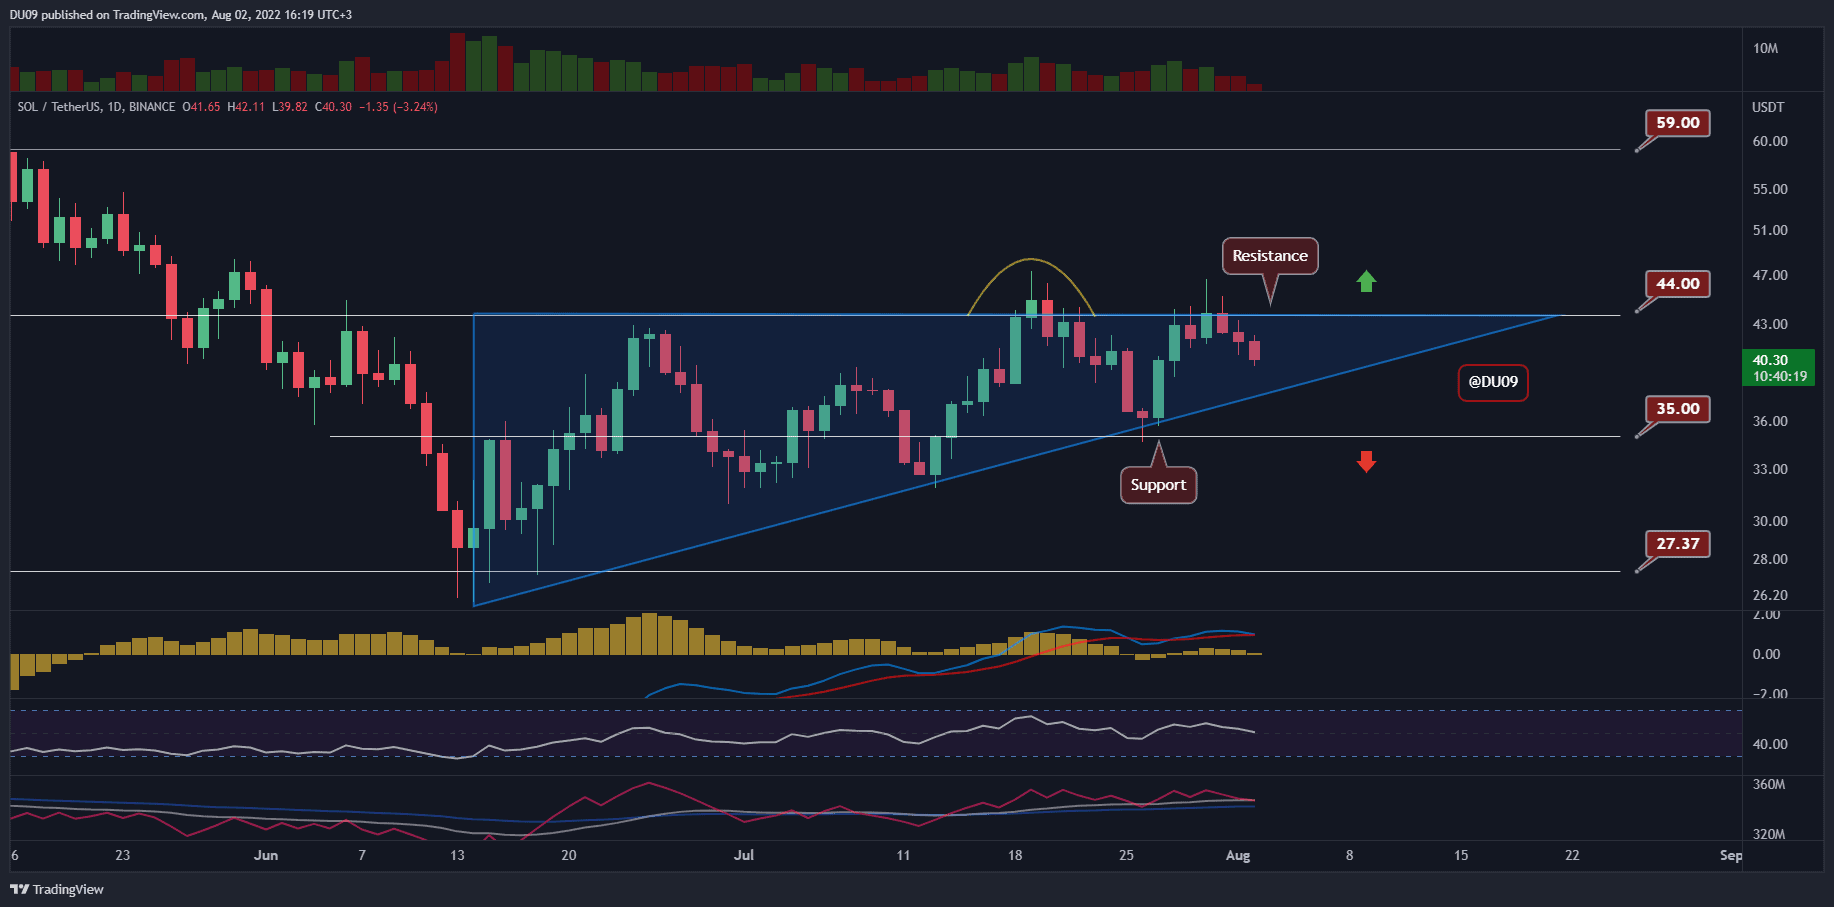
Solana was quickly pushed back by the sellers as soon as its price tried to move above the key resistance at $44. The price is now falling towards the key support at $35. If the cryptocurrency drops below the ascending triangle, then the bullish momentum will be compromised, and the correction could become more severe.
Since the price is approaching the apex of this formation, there is not much room left for the price to move until a clear break happens.

Technical Indicators
Trading Volume: The volume is in red but falling. Sellers appear to be losing interest as the price moved lower.
RSI: The daily RSI made a lower high, and if it also makes a lower low, then we could witness a change in the overall trend.
MACD: The daily MACD is dangerously close to a bearish cross. If this happens, then the price is likely to fall back on the support and lose its uptrend.

Bias
The short-term bias for SOL is bearish.
Short-Term Prediction for SOL Price
SOL’s price is quickly approaching a critical level. If buyers cannot stop the downtrend at $38, then the price will lose its bullish momentum and enter a more significant correction. The key supports are found at $34 and $27. Expect more volatility as the week progresses.


