SOL Explodes and Aims for $40 But is a Correction Imminent? Three Things to Watch This Week (Solana Price Analysis)
Solana’s spectacular performance continued this week and there are no signs it will stop.
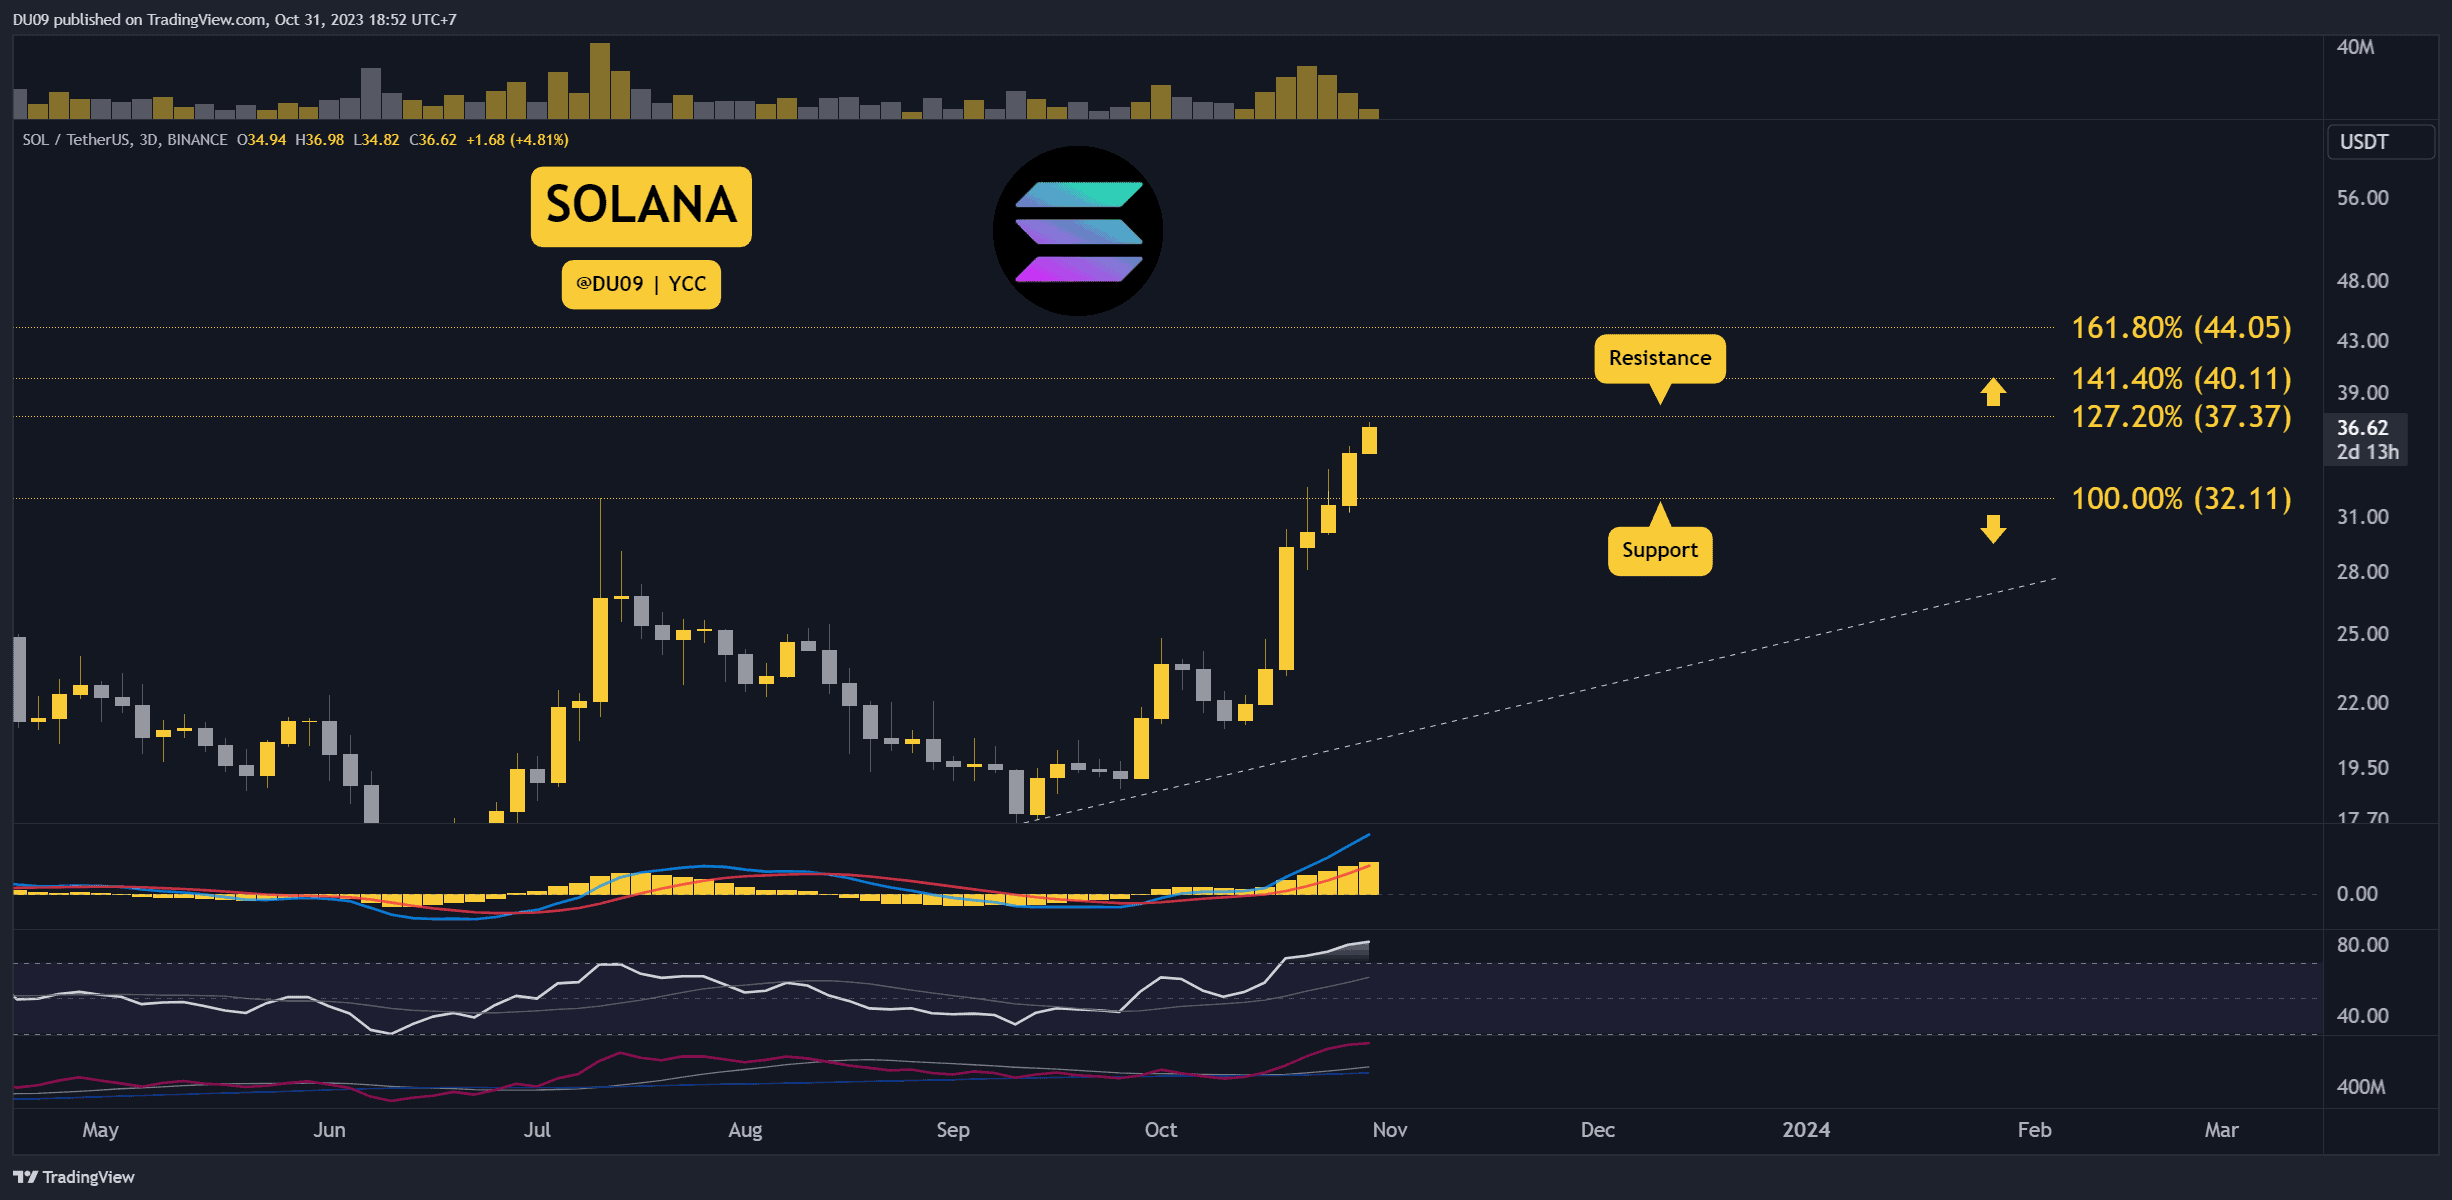
Key Support levels: $32
Key Resistance levels: $37, $40
1. Higher Highs Continue
With buyers unphased, Solana managed to reach a new local high at $37 which is a key resistance. If broken, SOL’s price will reach a valuation not seen since the FTX collapse.

2. Next Targets $37 and $40
Should the current resistance at $37 turn into support, then Solana could reach $40 next. This is a key level that is likely to bring back sellers looking to secure profits. That level could also lead SOL into a correction.

3. RSI is Overbought
The daily timeframe RSI is in the overbought region which is a bullish signal, but it could also invite sellers to return if the key resistance at $37 does not fall. In such a scenario, a pullback becomes likely.

Bias
The bias for SOL is bullish.
Short-Term Prediction for SOL Price
Solana looks very strong, but this rally has to break two key levels to continue. The price did not retrace at all since early October, and sellers could be waiting for an opportunity. Watch closely the price action around $37 for any signs of weakness.
The post SOL Explodes and Aims for $40 But is a Correction Imminent? Three Things to Watch This Week (Solana Price Analysis) appeared first on CryptoPotato.


