SOL Crashes 7% Weekly, is $27 Coming? (Solana Price Analysis)
Solana lost its bullish momentum and is now falling below the ascending triangle in search of support again.
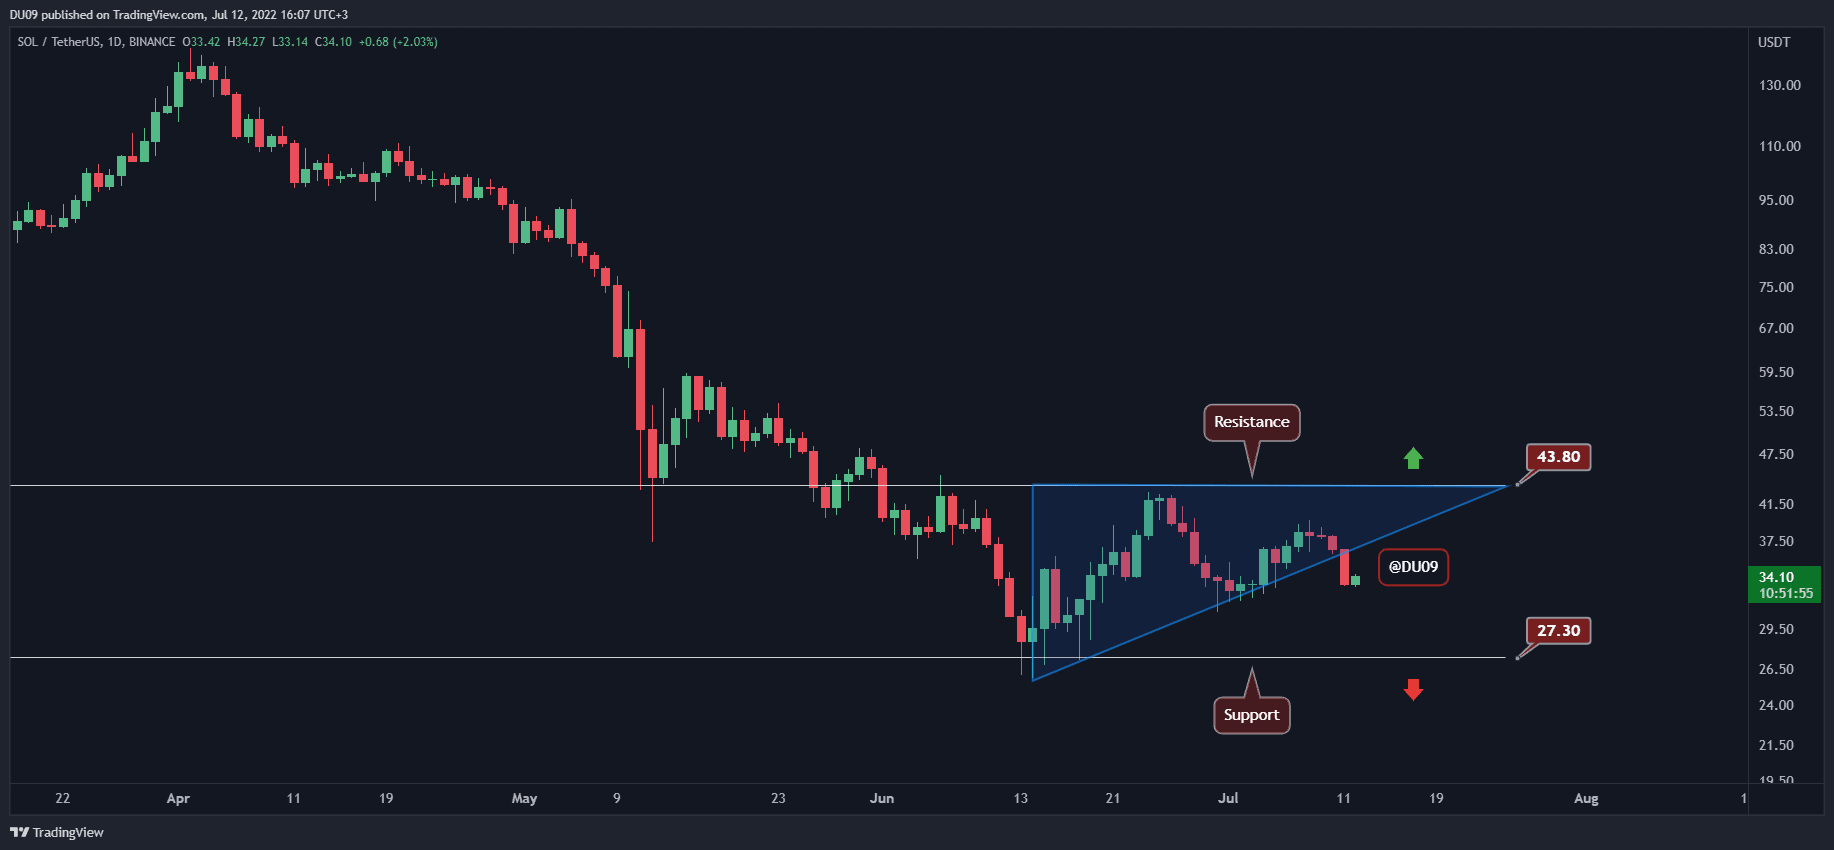
Key Support levels: $27
Key Resistance levels: $44
Solana failed to rally over the weekend, and bears took advantage of this to push it towards $33. In doing so, the cryptocurrency broke below the ascending triangle. Should the price continue downwards, SOL might find good support at $27. The key resistance is at $44.
Technical Indicators
Trading Volume: The volume decreased over the weekend, and today, it did not fare any better. So far, the bears have the upper hand.
RSI: The daily RSI could not stay above 50 points and fell under this key level. This places Solana in the bearish zone.
MACD: The daily MACD is quickly losing its bullish momentum. If buyers can manage to stop the downtrend at current levels, then SOL could reverse its downtrend.

Bias
The short-term bias for SOL is bearish.
Short-Term Prediction for SOL Price
The current breakdown from the ascending triangle is a bearish signal. However, sellers did not seem too eager to push prices much lower, and volume has decreased since the breakdown. If this continues, buyers may take over the price action and bring SOL back on the uptrend.