Signs of Seller’s Intent? Bitcoin Flooded Exchanges As Price Hit $10,000
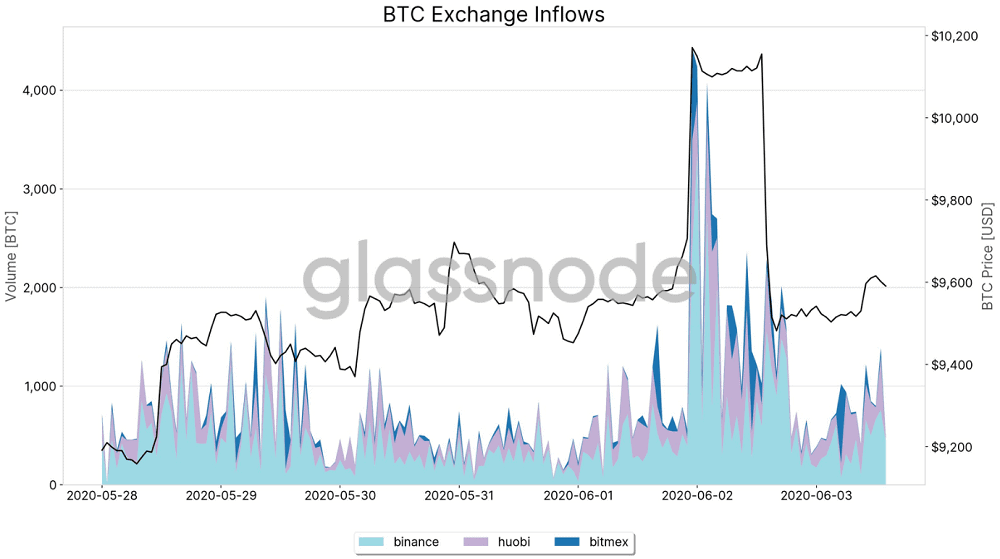
The inflow of Bitcoin to cryptocurrency exchanges more than quadrupled on June 2, when the Bitcoin price crossed above the $10,000 price range for the first time since February.
Bitcoin Holders Trying to Sell at $10,000?
Data courtesy of Glassnode reveals a sharp spike in the volume of Bitcoin transferred to exchanges during BTC’s rise to $10,000. Binance was the favored destination for most of the Bitcoin deposits, as seen on the graph below.

The blockchain analysts at Glassnode speculated the sudden influx of Bitcoin to exchanges was a clear sign of investors reacting to BTC’s price increase. They tweeted:
“Bitcoin inflows to major exchanges spiked during BTC’s recent sharp increase to $10,000, clearly showing investors’ reaction to the sudden price surge.”
That reaction could be perceived as being uncertainty, given that soon after flirting with the $10,500 mark, Bitcoin immediately sunk to anywhere between $8,600 and $9,400 – depending on the trading platform.
The number one coin’s gravitational pull wreaked havoc on the rest of the cryptocurrency market, eventually erasing $18 billion from the global market cap in just under two hours.

Bitcoin’s Recent History of Troubles with $10,000
Bitcoin’s drop from the $10,000 range coincided with $449 million worth of BTC long liquidations aggregated from major exchanges. As previously reported by CryptoPotato, that number doesn’t include the sum of the short orders which would have been liquidated during the pump before the dump.
By all accounts, the $10,000 mark remains a psychological barrier that is yet to be navigated successfully by Bitcoin traders. The last time BTC successfully surpassed that level was mid-February of this year.
In the month that followed, Bitcoin went on to lose over 54% of its value. The majority of those losses came in just one day, now dubbed “Black Thursday” when BTC fell 40% in value in 24 hours on March 12.
On May 7, just a few days before the halving event of 2020, Bitcoin spiked to retest the $10,000 but couldn’t hold there for much longer as the sellers were quick to sell and the price dropped to as low as $8100 on the day of the halving – May 11.
Despite the sudden arrival of Bitcoin onto major exchanges and the drop from the vaunted $10,000 range, Bitcoin’s losses for the day reached just 7% at its lowest point. Following a swift rebound, as of now, BTC climbed back to the $9,600 range, leaving 24-hour losses at just over 5%.
The post Signs of Seller’s Intent? Bitcoin Flooded Exchanges As Price Hit $10,000 appeared first on CryptoPotato.


