Short-Term And Long-Term Bitcoin Holder Cost Bases Indicate Changing Market Conditions
The short-term and long-term bitcoin holder cost basis ratio is trending downward, signaling a shift in market conditions.
The below is from a recent edition of the Deep Dive, Bitcoin Magazine’s premium markets newsletter. To be among the first to receive these insights and other on-chain bitcoin market analysis straight to your inbox, subscribe now.
One of our favorite on-chain indicators recently flipped bullish. The STH (short-term holder) LTH (long-term holder) cost basis ratio recently has started to trend downward over the last two weeks, indicating a shift in market conditions.
The metric is first explained in detail in The Daily Dive #070.
Historically the metric has been one of the most accurate market indicators in Bitcoin, as the relationships between short-term and long-term holders and the acceleration/deceleration of cost basis of the two respective cohorts is quite informative.
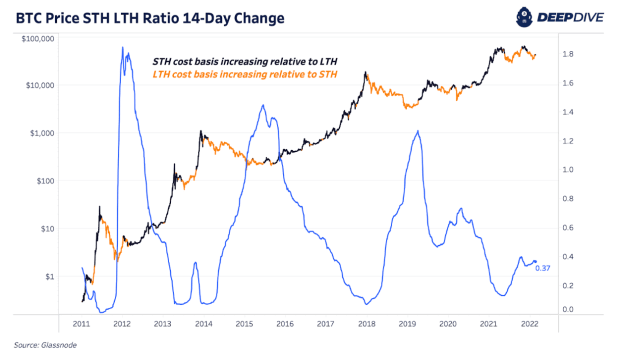
While it is true that short-term holders are still underwater in aggregate (relative to the average cost basis of the cohort) the market absorbed lots of realized losses during the last few months, and with a relative accumulation occurring, the STH LTH Ratio has flipped back bullish.
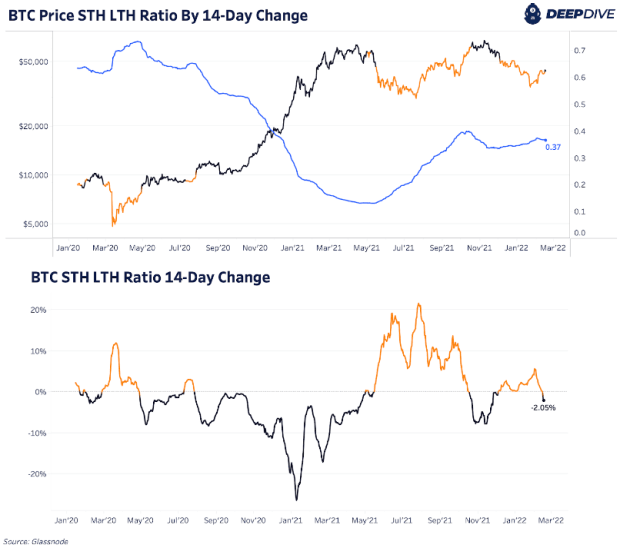
A backtest of the ratio over time speaks for itself:
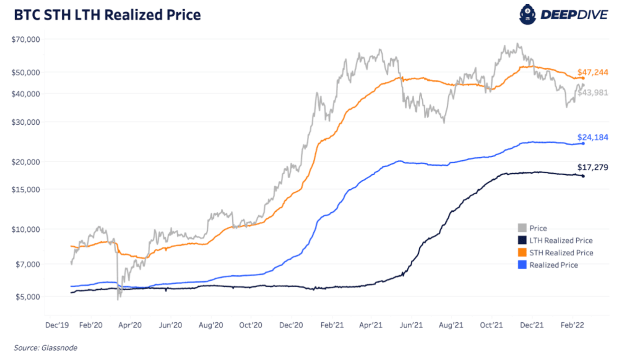
Below is a view of the inputs that go into the ratio itself:
Similarly, last Wednesday in The Daily Dive #144 we highlighted the bullish flip in the delta gradient, another market momentum metric.