Shiba Inu Price Analysis: SHIB’s Recovery Shaky, This is the Support to Look Out For
Shiba Inu saw a significant bounce, but the price quickly reversed back towards the key support.
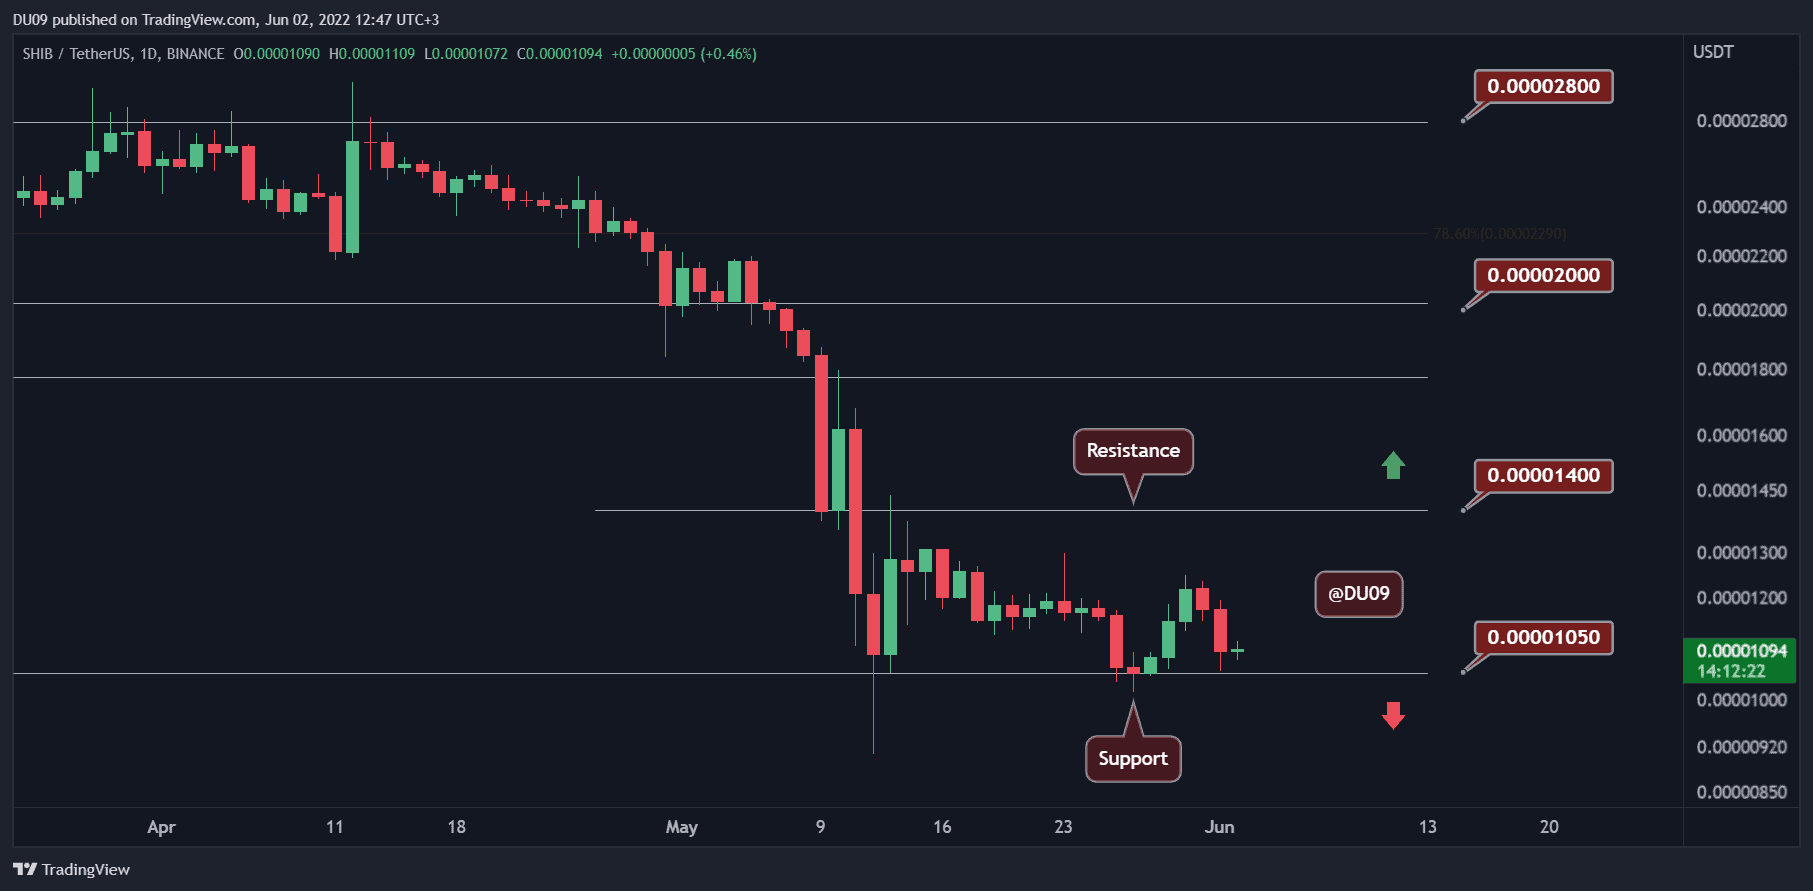
Key Support level: $0.000010, $0.000008
Key Resistance level: $0.000014, $0.000017
SHIB is found in a range with the key resistance at $0.000014 and support at $0.000010. The price made a good attempt at rallying and managed to reach the middle of the range. However, once there, bears took over and pushed the cryptocurrency back towards the support.
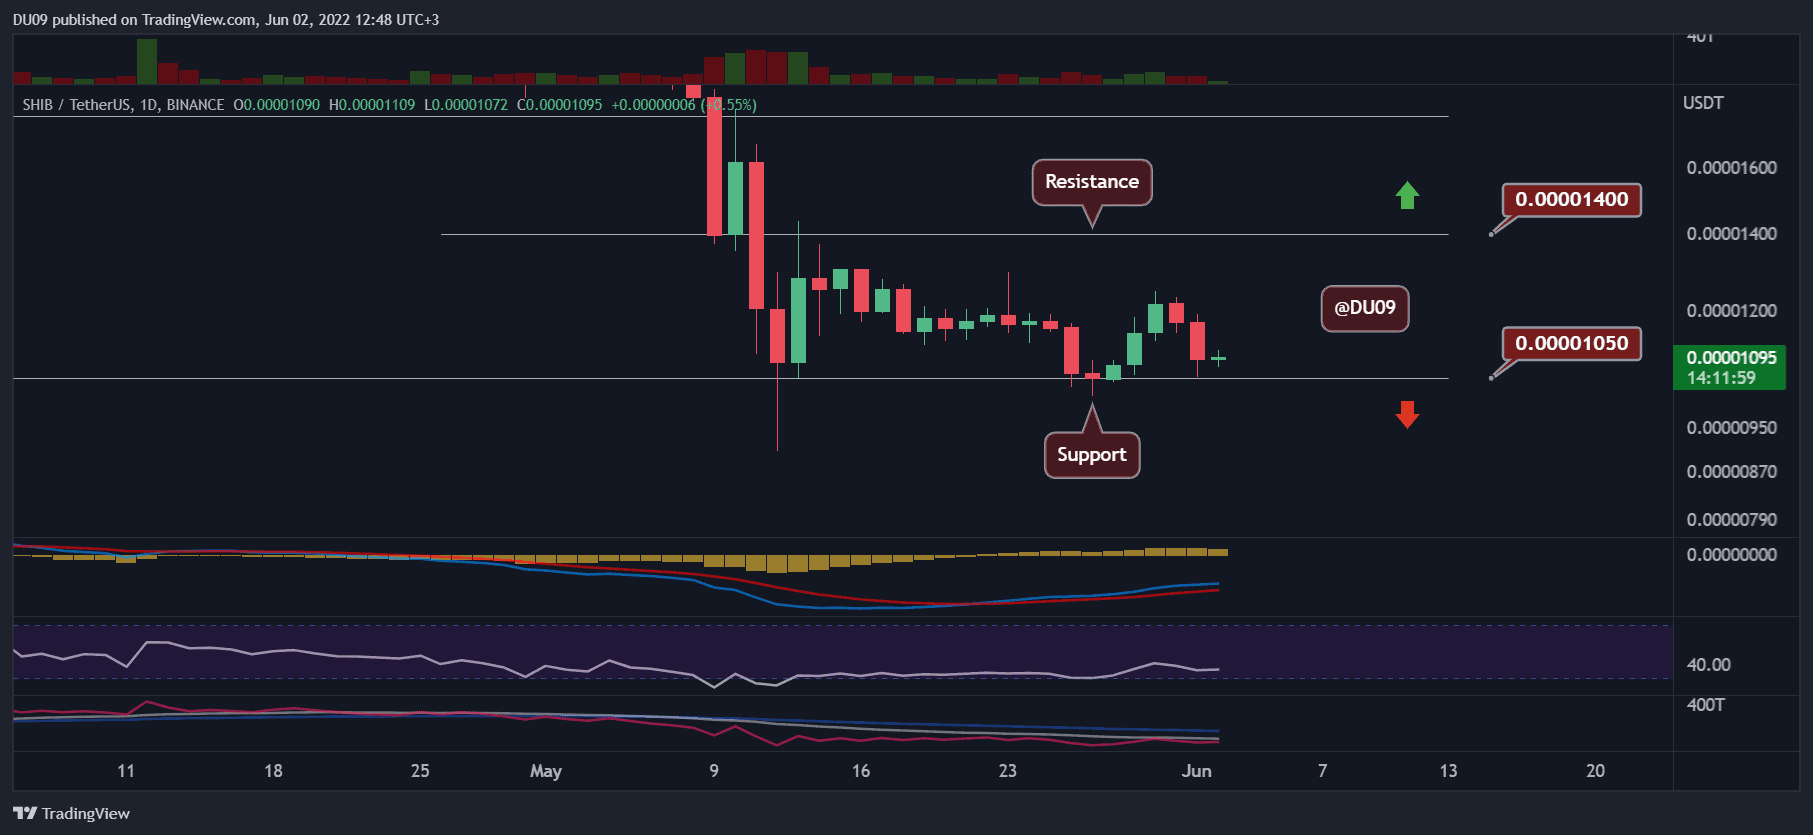
Technical Indicators
Trading Volume: The trading volume is low right now, signaling considerable uncertainty in the market.
RSI: The daily RSI has finally made a higher high and turned bullish. The buyers must defend the current support level to not lose this momentum.
MACD: The daily MACD is bullish with an expanding histogram. However, this latest price drop reduced the momentum for buyers.
Bias
The bias on SHIB is neutral. A break of the key resistance would change it.
Short-Term Prediction for SHIB Price
SHIB has a chance to reverse here and return to an uptrend if the buyers return. If so, the price will then be able to test the key resistance at $0.000014. If bulls fail and the key support is broken to the downside, then a plunge towards $0.000008 becomes more likely.