Shiba Inu Price Analysis: SHIB Staging a Recovery Following a 24% Weekly Crash
Volatility has decreased since the crash on May 12th, and the price appears to be staging a significant move soon.
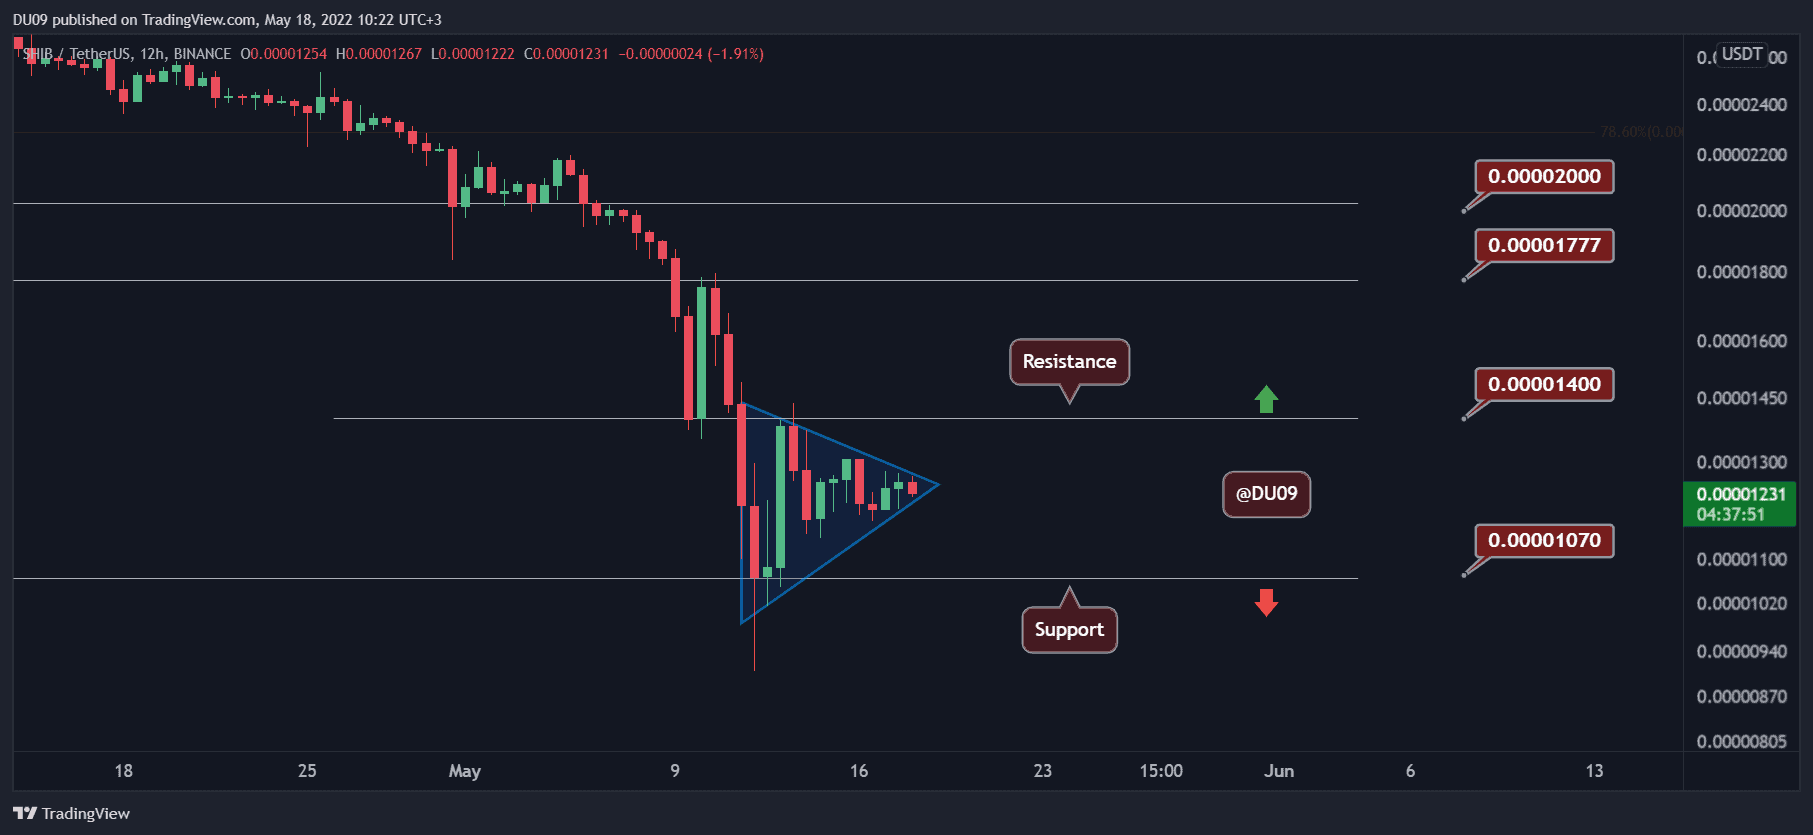
Key Support level: $0.000010
Key Resistance level: $0.000014, $0.000017
SHIB has formed a large pennant (in blue in the chart below) which can break as soon as volatility returns. The current support is found at $0.000010, and the indicators suggest a bullish move might be in the cards soon, where SHIB could test the key resistance at $0.000014.
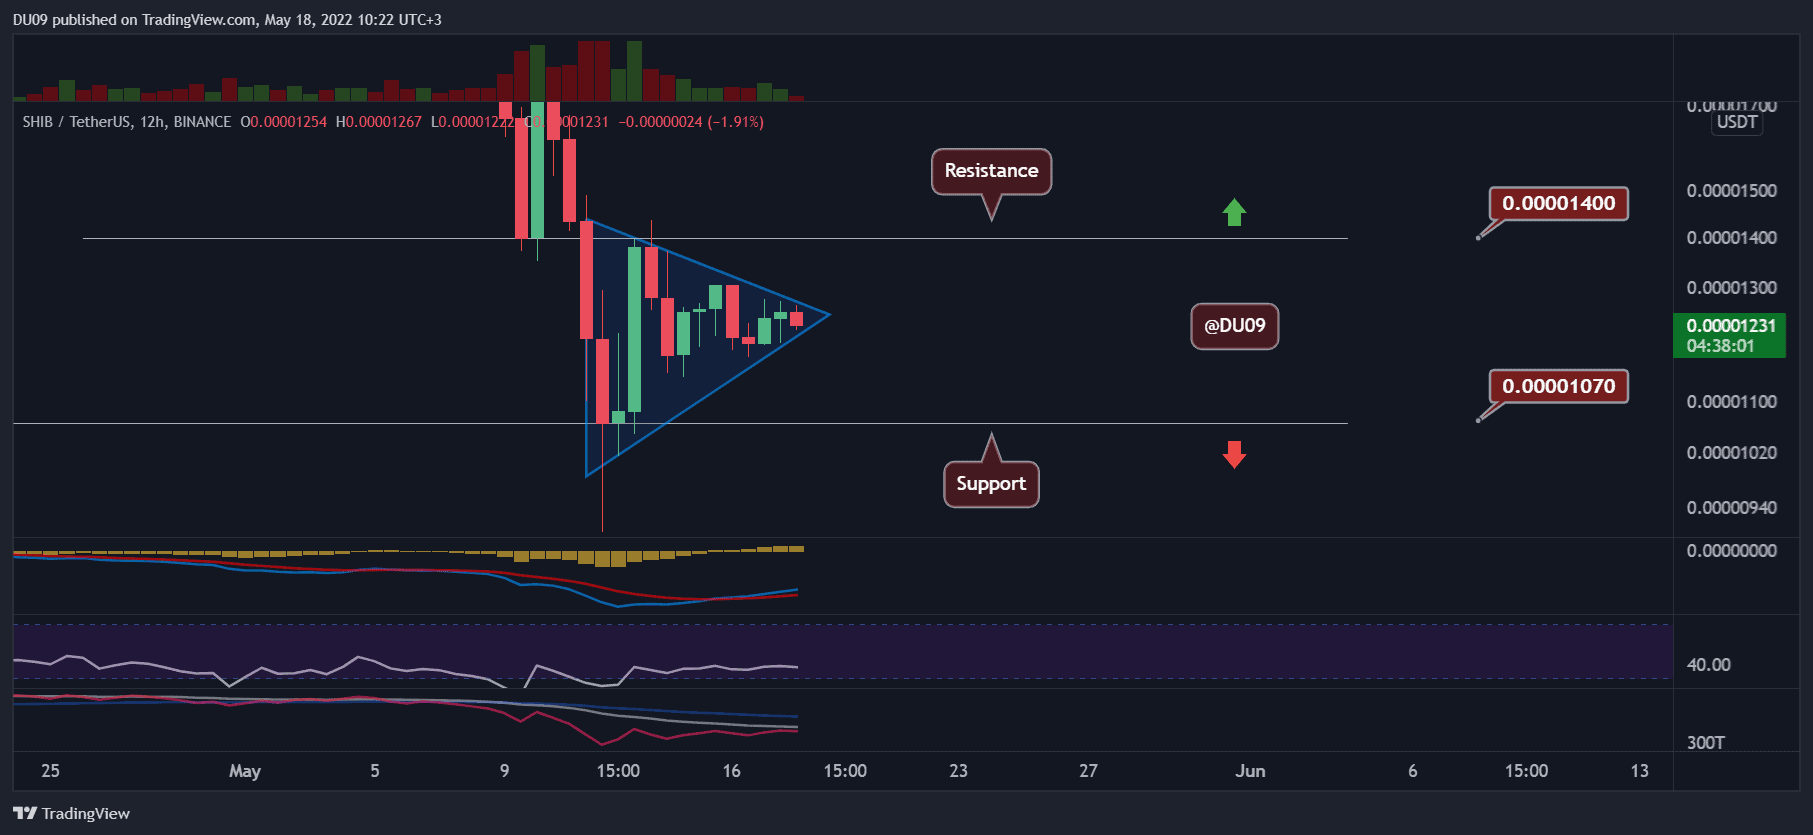
Technical Indicators
Trading Volume: The volume has been low lately, but this is likely to change as soon as a break from the current formation takes place.
RSI: The daily RSI is making higher lows, and it is about to also make a higher high. If this move intensifies, then the bias for SHIB could flip to bullish.
MACD: The daily MACD is still bearish, but the histogram is bullish. A few days of this price action – and the key resistance may be tested.
Bias
The bias on SHIB is neutral. This can change to bullish if it breaks above the pennant.
Short-Term Prediction for SHIB Price
A test of the key resistance at $0.000014 appears likely, but only if the price manages to break above its current levels on renewed momentum. If successful, SHIB’s next key resistance will be found at $0.000017.