Shiba Inu Price Analysis: SHIB Rests on Critical Support Following 8% Weekly Drop, What’s Next?
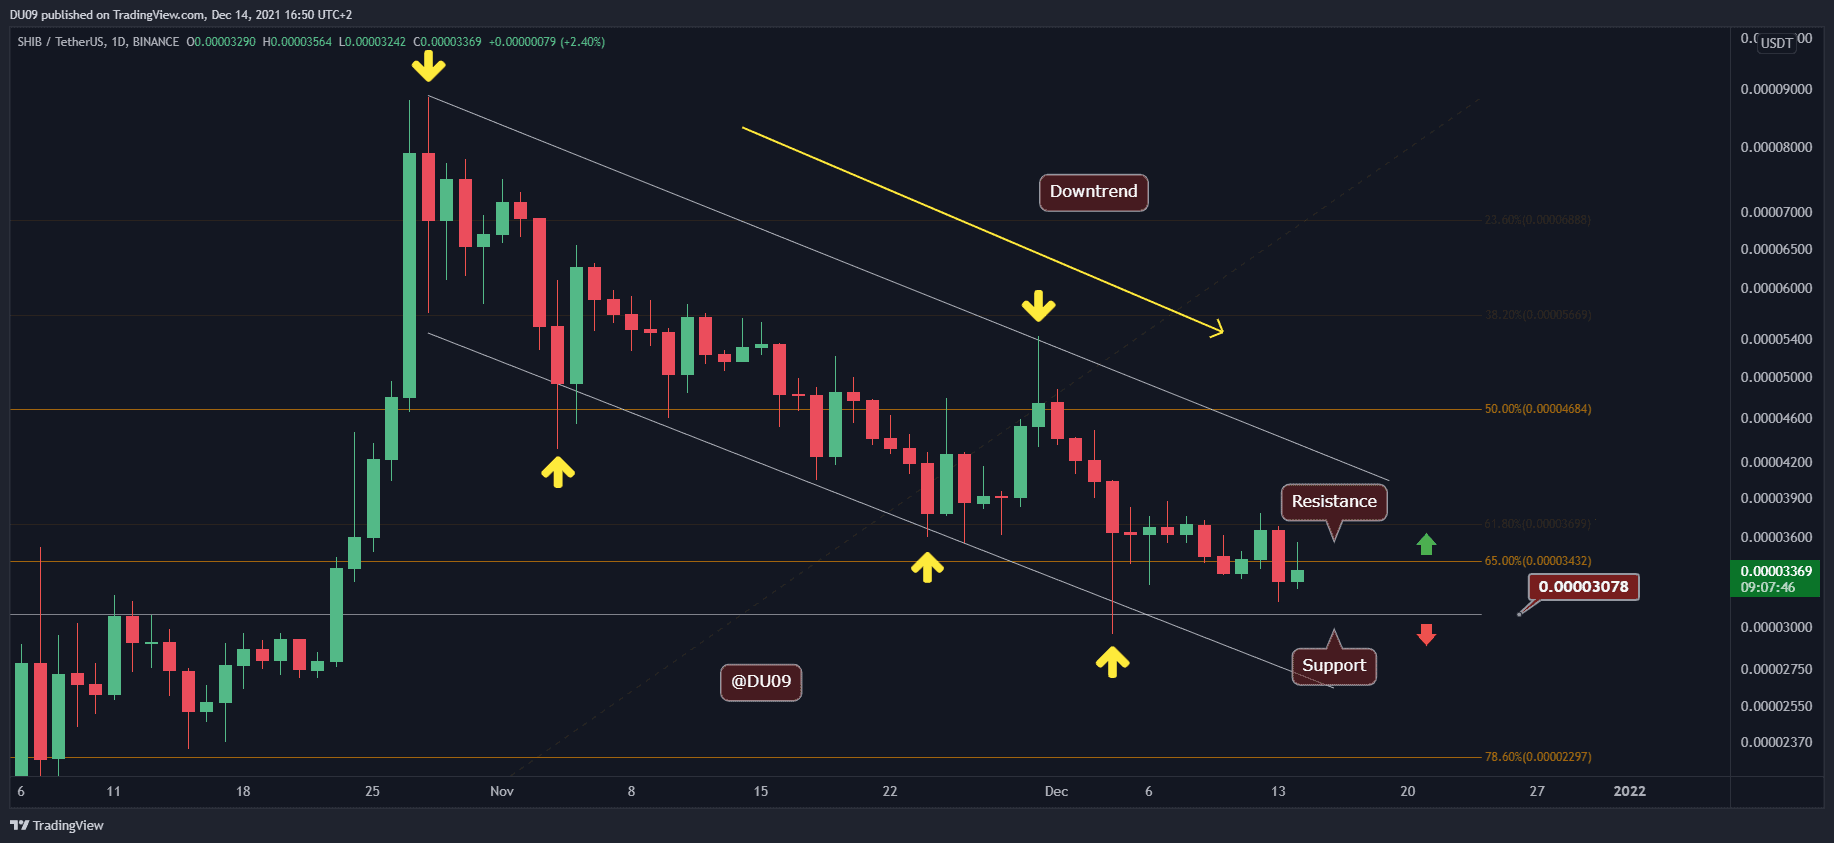
Key Support levels: $0.000030, $0.000022
Key Resistance levels: $0.000034, $0.000037
SHIB found support on the $0.000034 level and seemed primed to move higher when the bears took over the market. This level was turned into resistance as SHIB’s price fell with the overall market. For this reason the new support is now found at $0.000030.
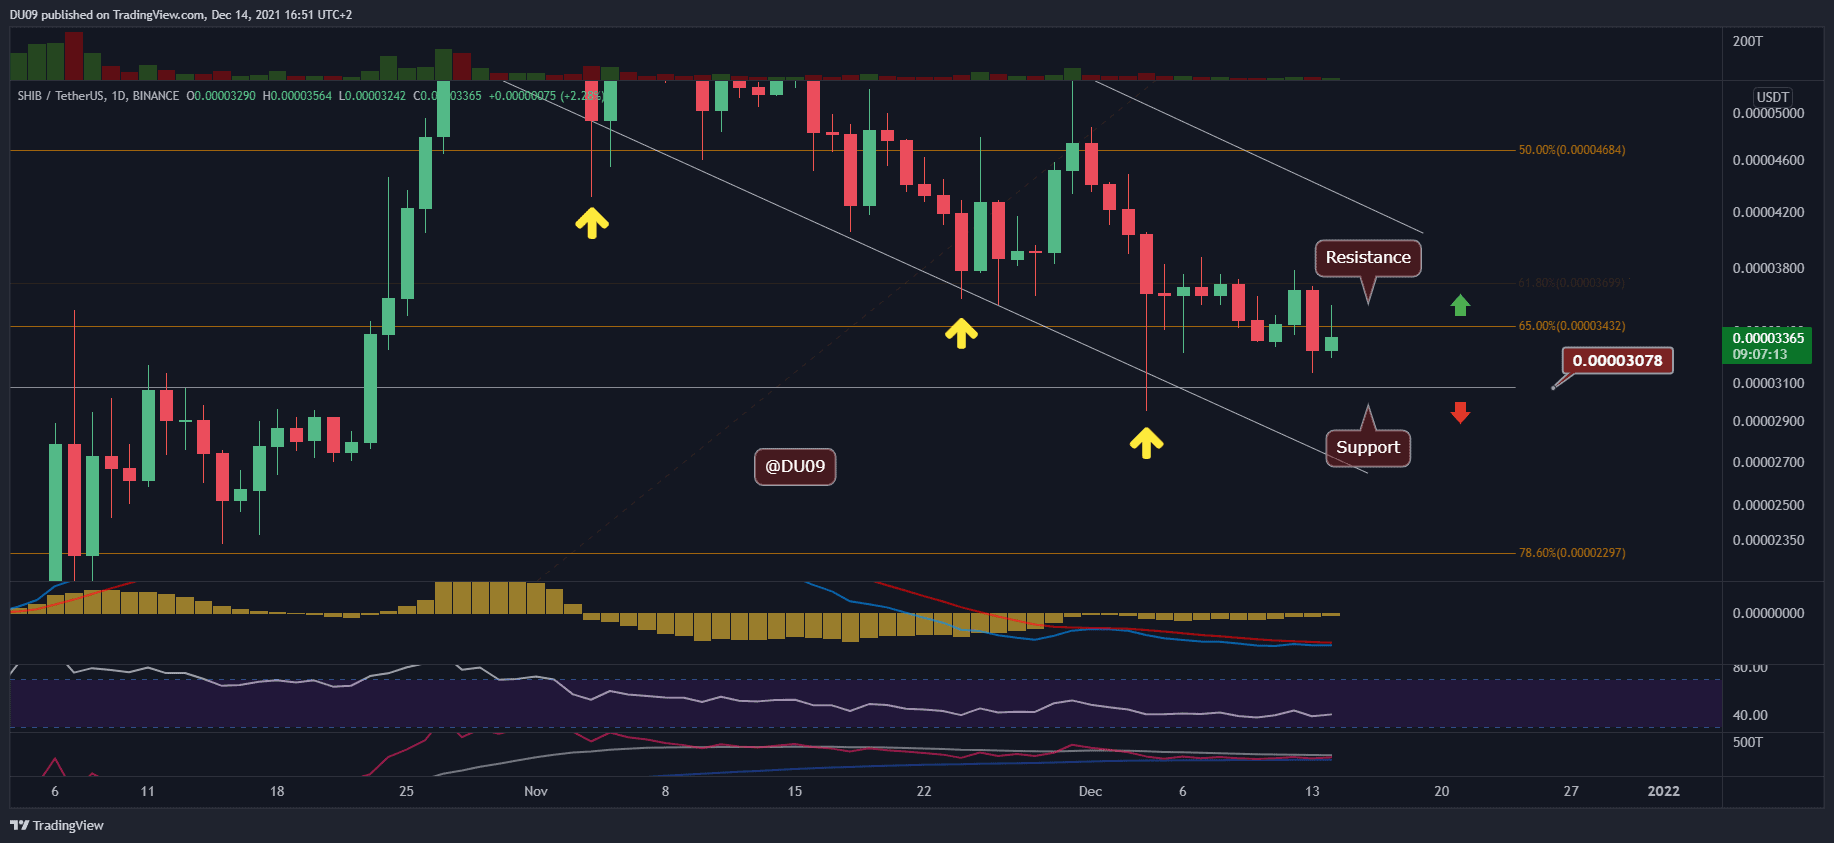
SHIB was very close to completing a bullish crossover on the daily MACD, but this recent drop stopped it from happening. It could make another attempt later when the overall market conditions are more favorable. Either way, the price is stuck in a large descending channel and a break above it is necessary to reverse the bearish trend.

Technical Indicators
Trading Volume: The volume remains low and interest will only return to SHIB once the price action becomes more exciting.
RSI: The RSI marked a higher low during this most recent drop on the daily timeframe. This shows that buyers are keen to return to SHIB if market conditions allow.
MACD: The daily MACD is trying to curve up in preparation for a bullish crossover. With a bit of luck, SHIB may be able to do so and bring much needed volume and momentum back.

Bias
The bias for SHIB is neutral in the short term, but it’s important to keep a close eye on the MACD.
Short-Term Price Prediction for SHIB
Even if SHIB manages to rally, it’s important to remain mindful of the larger structure represented by the descending channel which will likely act as resistance to any bullish move. Only a break above this channel will give sufficient confidence in such a rally. Otherwise, SHIB may continue to bounce between the key levels as it strives to stop the downtrend.


