Shiba Inu Price Analysis: SHIB Price Displays Bullish Signs, Here Are Possible Targets
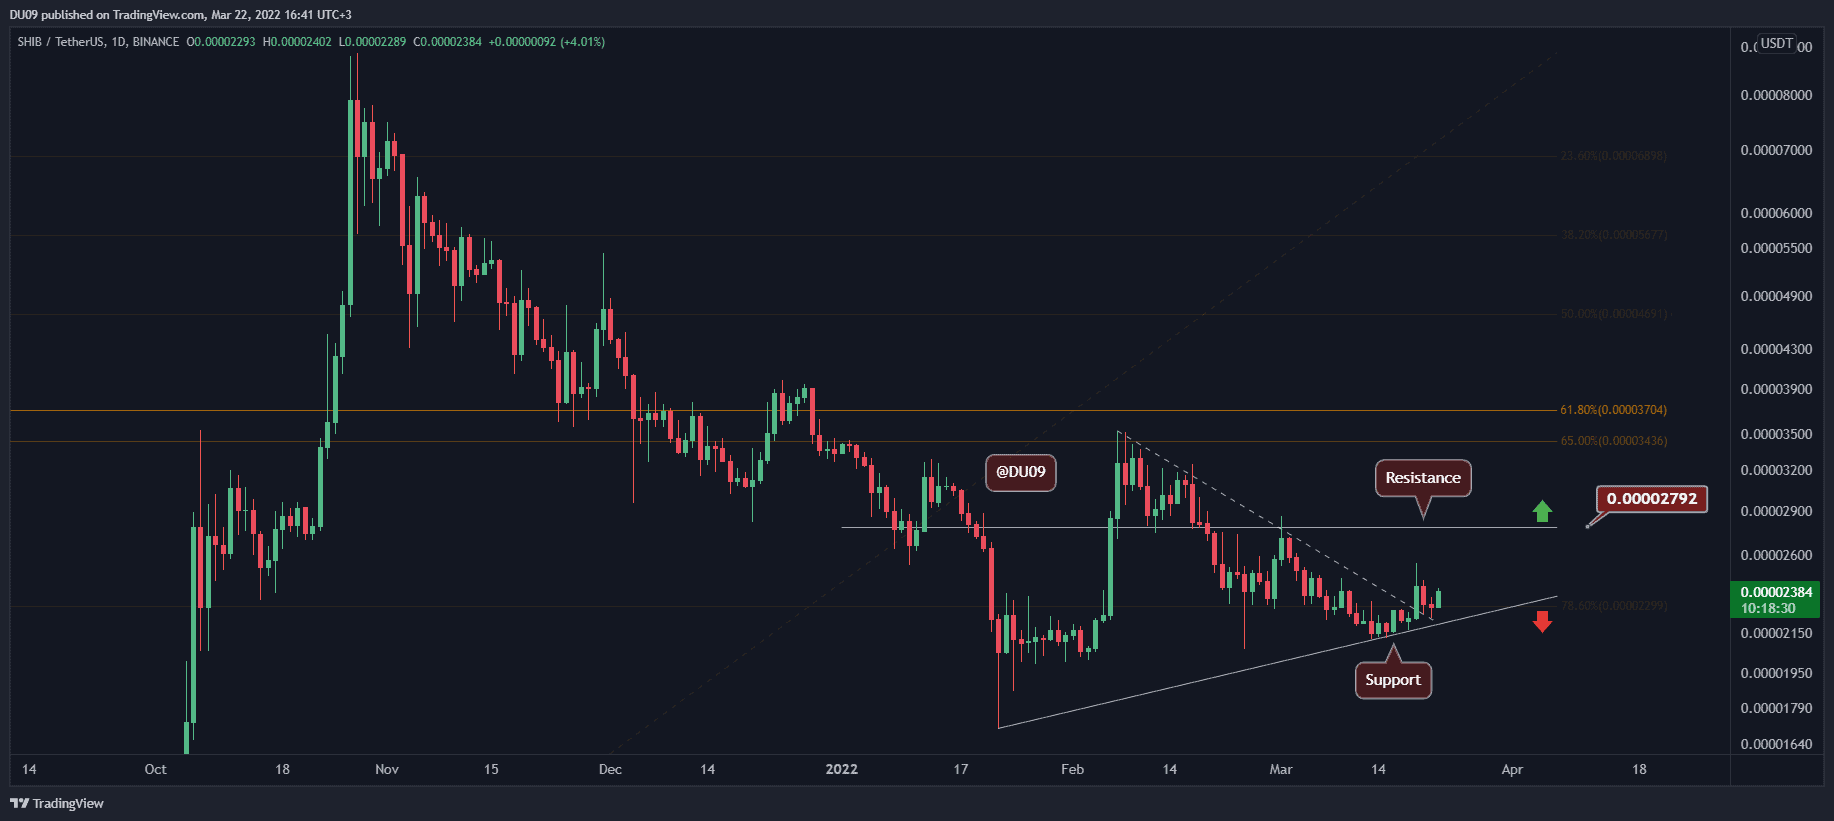
Key Support level: $0.000023
Key Resistance levels: $0.000028
On Saturday, SHIB’s price moved above the descending trendline that was acting as resistance (in dotted line) with good volume. Since then, the price has continued upwards and may reach the key resistance at $0.000028 if momentum maintains. The current support is found at $0.000023.
Technical Indicators
Trading Volume: The volume had a nice increase last Saturday during the break, but struggled to remain at that level in the following days.
RSI: The daily RSI is found at 50 points and curving upwards. If it can make a higher high, then that would be an additional bullish signal.
MACD: The daily MACD is bullish with momentum picking up for buyers. This could anticipate a further increase in price soon.

Bias
The bias on SHIB is leaning bullish in the short term.
Short-Term Prediction for SHIB Price
If buyers manage to keep this momentum and don’t let the price fall below the current support, SHIB has a considerable chance to move much higher and test the key resistance at $0.000028. The most recent correction and downtrend appear over, therefore the price action favors bulls.