Shiba Inu Price Analysis: SHIB Plunges 17% Weekly as Downtrend Accelerates
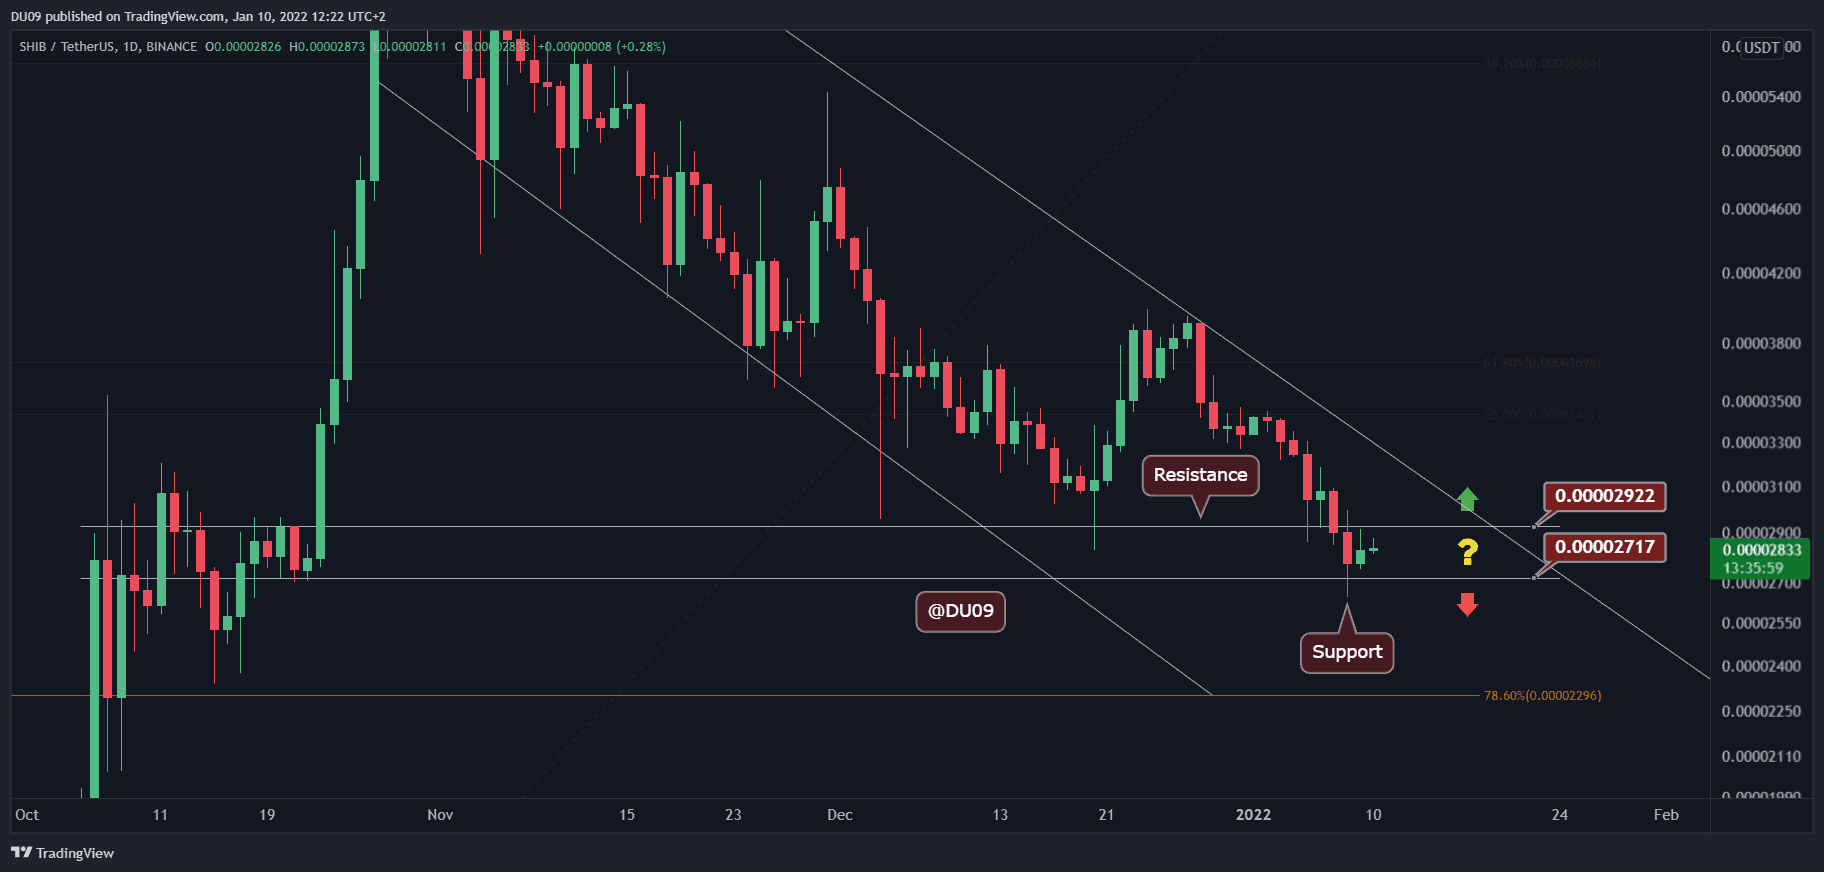
Key Support level: $0.000027
Key Resistance level: $0.000029
Last Saturday, SHIB fell to $0.000027, making a lower low which reconfirmed the downtrend. At the time of this post, SHIB appears to have formed a large downtrend channel which is characterized by lower lows and lower highs in price levels. The current resistance is at $0.000029, placing SHIB in a very tight range.
As long as SHIB is unable to stop this downtrend, the price will continue to go lower.
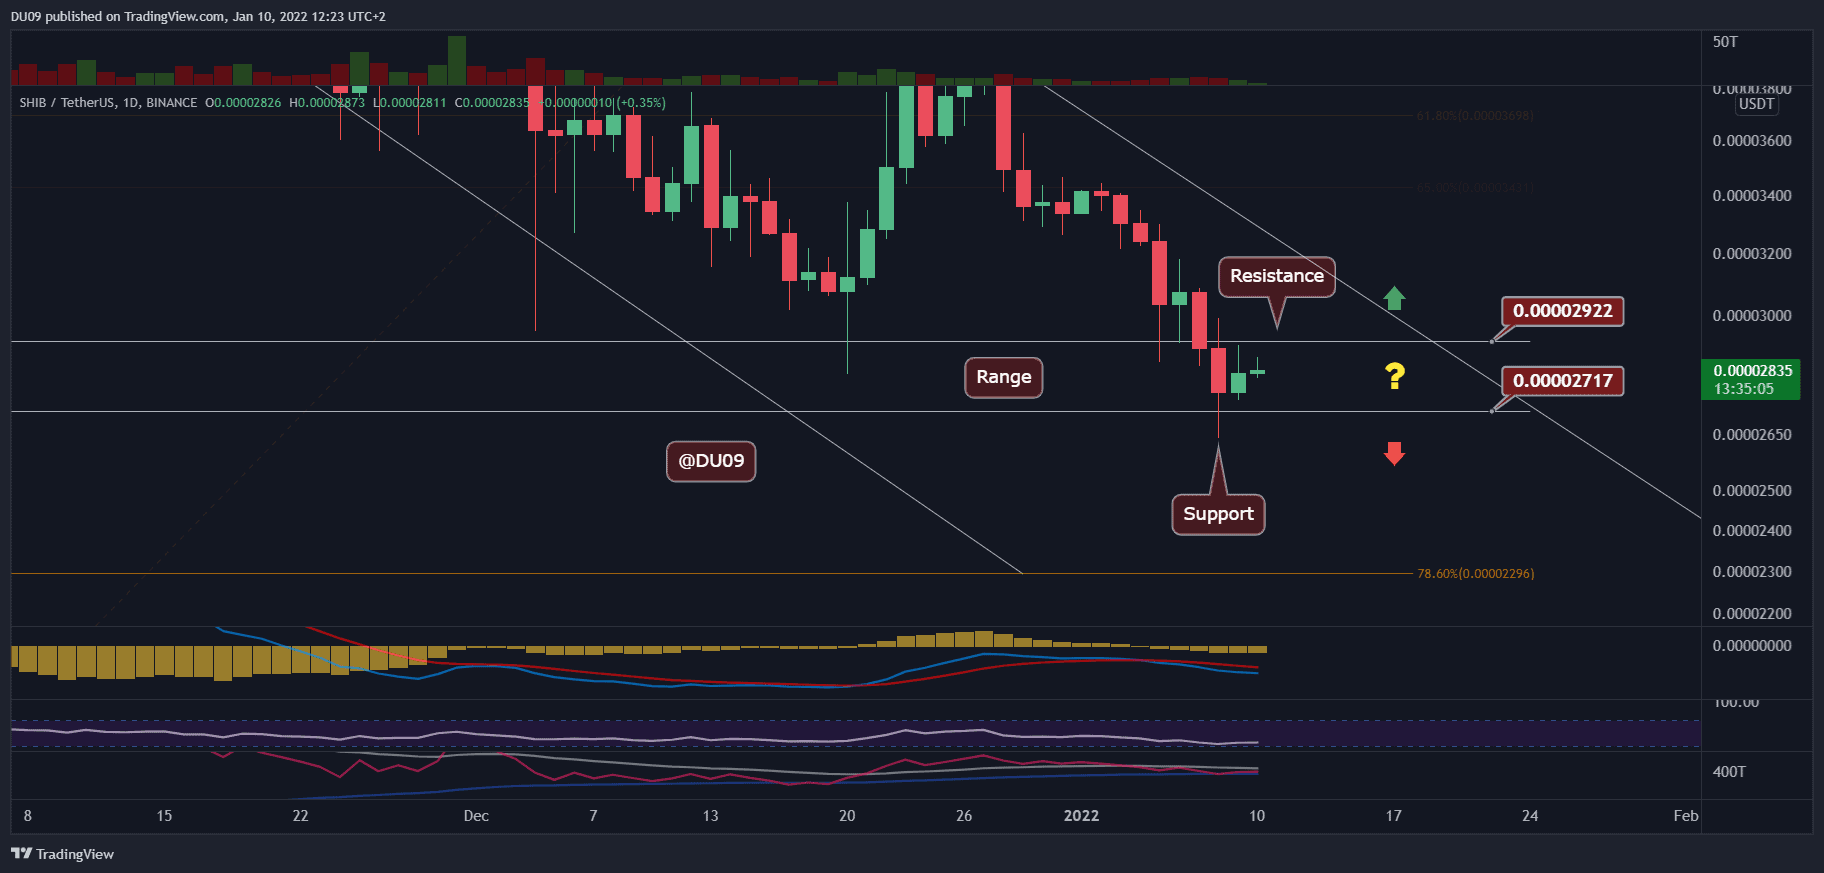
Technical Indicators
Trading Volume: The volume continues to be low, and it seems likely that the cryptocurrency won’t see much interest from buyers so long as this downtrend is maintained.
RSI: The daily RSI almost reached the oversold area last weekend. However, the price action remains bearish, which could mean that RSI will eventually fall under 30 points.
MACD: The daily MACD is bearish, but the momentum has reduced a bit as the histogram made a higher low today. This is a good sign for bulls.
Bias
The bias on SHIB is bearish. Price may fall below the current support level as it seems less likely for it to stay within this range.
Short-Term Prediction for SHIB Price
Hope in a reversal appears far away at this time for SHIB holders. Nevertheless, the price has reached a key area where further selling has a poor risk/reward ratio. As price continues to fall, buyers might become more tempted due to the opportunity cost of missing out on an eventual rally.