Shiba Inu Price Analysis: SHIB Drops 15% in Two Days as Market Tumbles
Key Support level: $0.000030
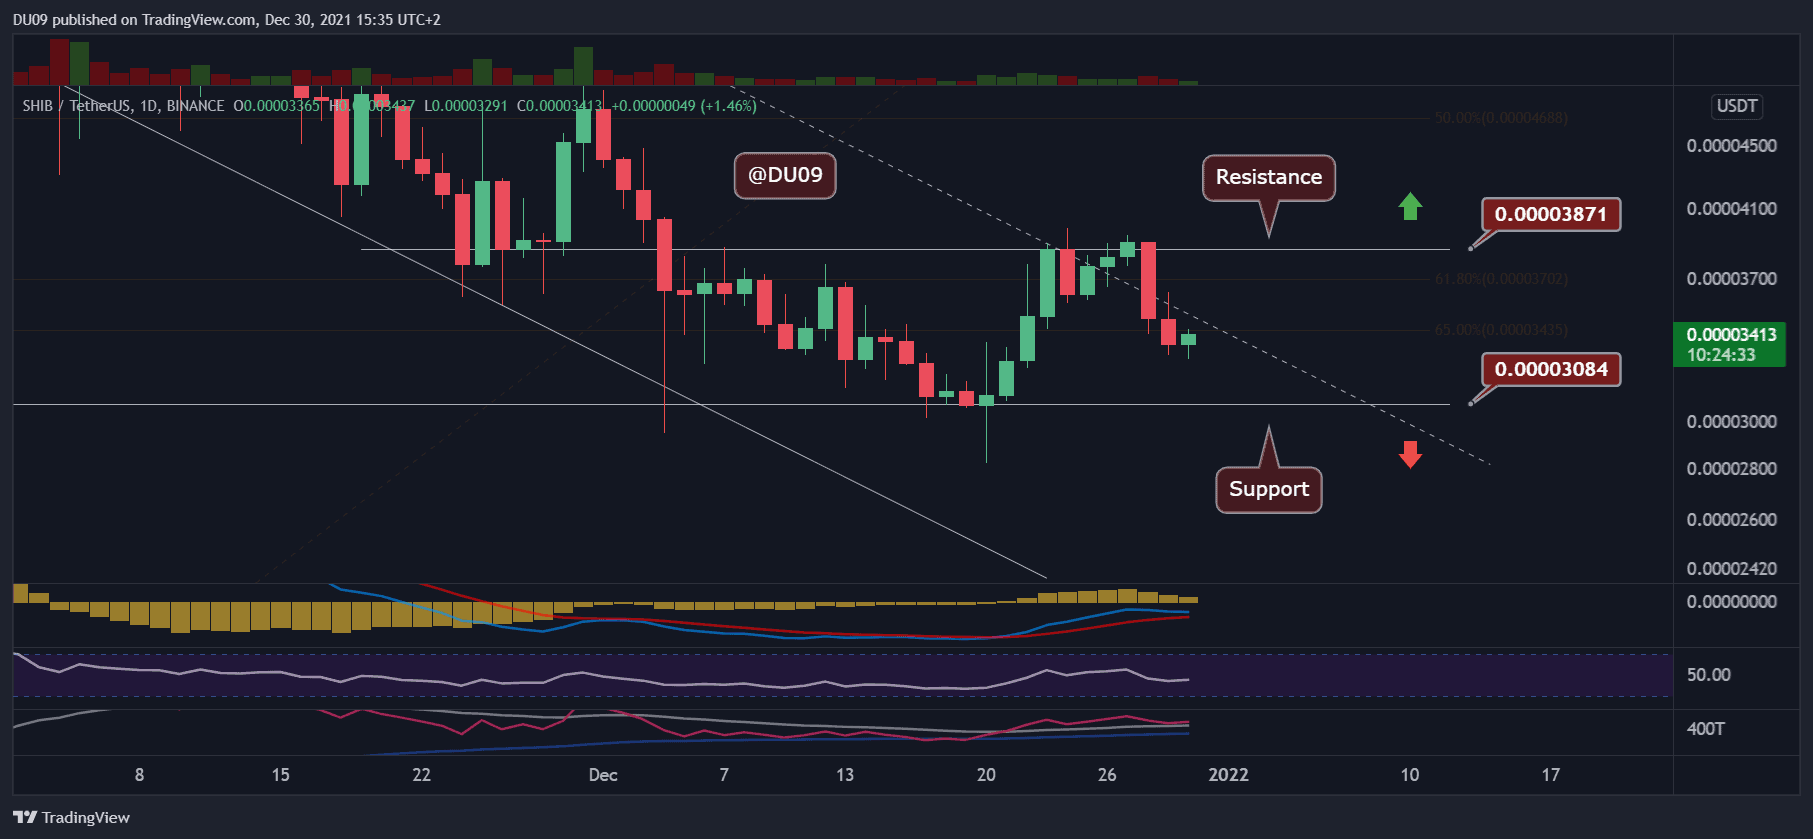
Key Resistance level: : $0.000038
SHIB was rejected by the $0.000038 resistance and pushed lower following the market’s downturn that started on Tuesday. The current support is found at $0.000030 and could be retested if the overall market remains bearish.

Technical Indicators
Trading Volume: The volume has been low despite the current correction. This gives hope that SHIB can quickly reverse course once buyers return.
RSI: The RSI on the daily has stopped falling at the time of this post and if the price manages to do the same then this could be interpreted as a higher low, which is bullish.
MACD: The daily MACD remains bullish. If SHIB can reverse course from this point onwards there is a good chance it can move higher and break the current resistance level.
Bias
The bias on SHIB is neutral. The cryptocurrency appears to be stuck in a flat trend at the time of this post.
Short-Term Prediction for SHIB Price
If SHIB is successful in breaking above the current resistance at $0.000038, then the bias can change to bullish. Until then, the price will remain in a range between support and resistance as it moves sideways.