Shiba Inu Price Analysis: SHIB Crashes 10% Over the Weekend, Here’s the Next Target
Shiba Inu failed to break above the key resistance and crashed by 10% in two days.
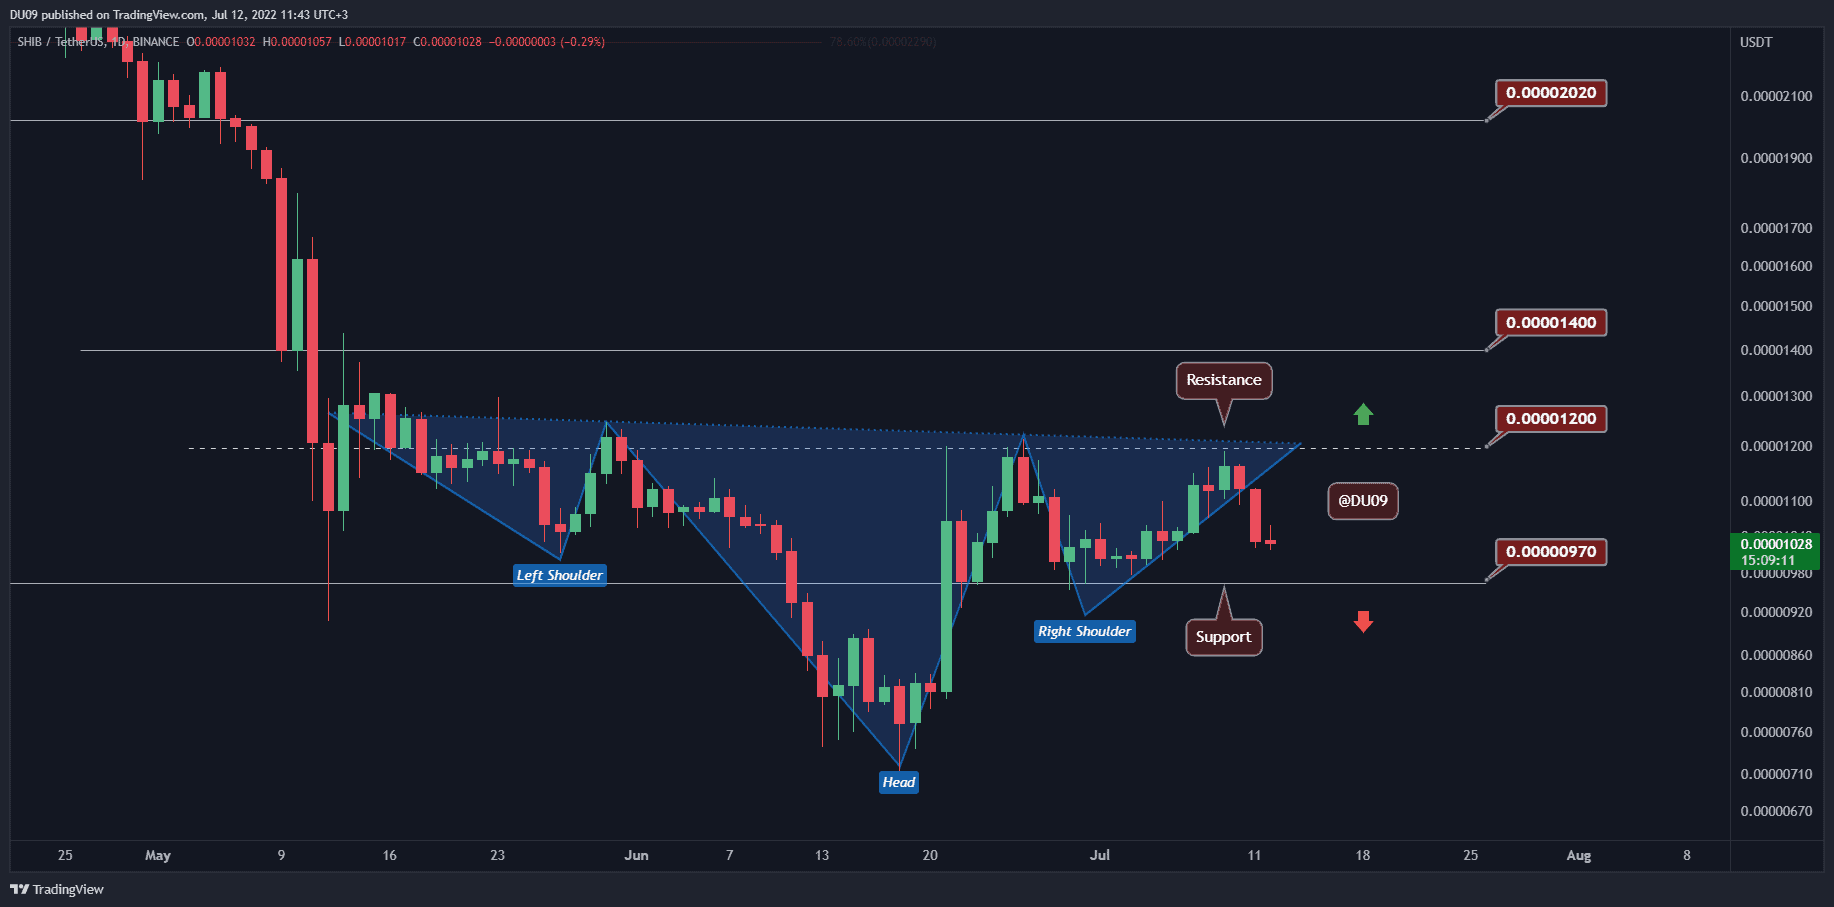
Key Support level: $0.000010, $0.000008
Key Resistance level: $0.000012, $0.000014
The price formed a large inverted head and shoulders structure, with the neckline mirroring the key resistance at $0.000012. Unfortunately for the bulls, SHIB was sharply rejected at this key level over the weekend, and since then, the cryptocurrency entered a downtrend. The key support is found at $0.000010, and SHIB may touch this level before another attempt to move higher.
Technical Indicators
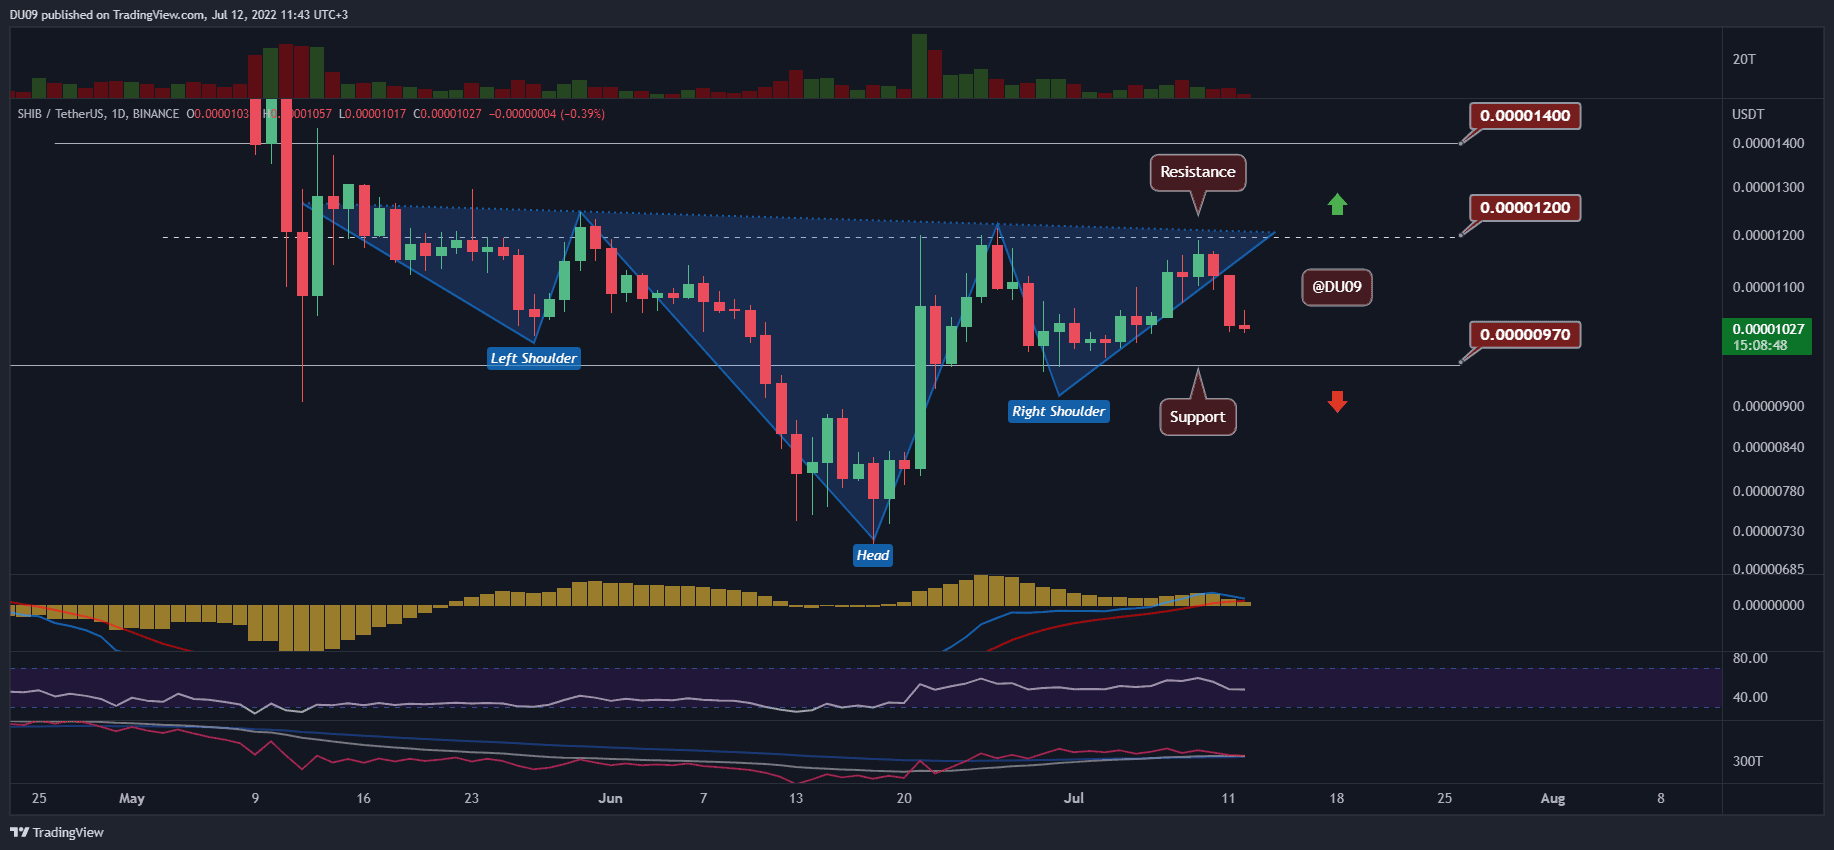
Trading Volume: The selling volume has remained rather low but this doesn’t provide much hope for the bulls either.
RSI: The daily RSI fell under 50 points and may make a lower low if the buyers fail to stop the current downtrend. This would be bearish.
MACD: The daily MACD is curving down sharply and may flip to the bearish side in a day or two if buyers cannot stop this selloff.
Bias
The bias on SHIB is bearish.
Short-Term Prediction for SHIB Price
Despite a quick price drop once SHIB touched the key resistance, sellers don’t seem confident considering the volume. If buyers manage to hold the correction at the key support of $0.000010, then they could attempt another break above $0.000012 later on.