Shiba Inu Price Analysis: SHIB at a Critical Point Following 5% Daily Loss
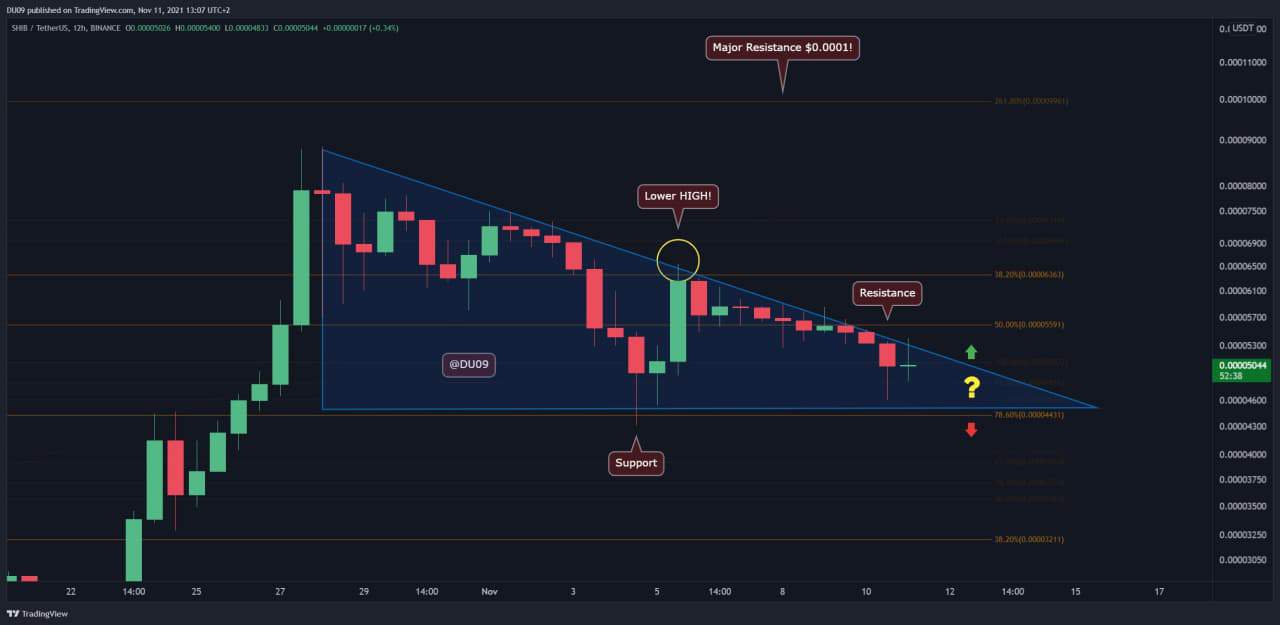
Key Support level: $0.000044; $0.000032
Key Resistance level: $0.000055; $0.000063
SHIB’s correction has continued this week as indicated in our last analysis and is now close to a key decision. If the price can break above the descending triangle in blue, this can lead to a rally. If it fails to do that, then the support at $0.000044 can break and lead SHIB lower to the next level. Until then, SHIB is stuck in this descending triangle with less and less room for the price to move.
Technical Indicators of SHIB Price
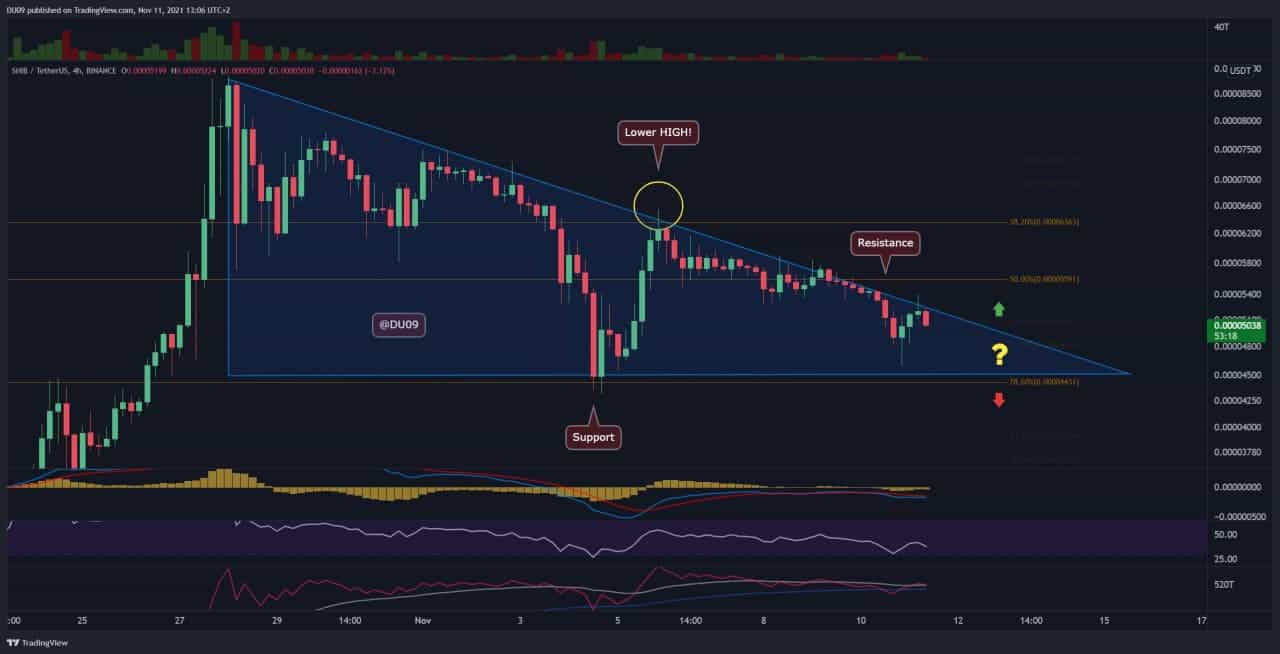
Trading Volume: Unfortunately for bulls, in the past week, the volume on bearish candles has always exceeded the volume during bullish candles. This is indicative of a bearish trend.
RSI: The RSI continues to fall on the daily timeframe. However, there are some early signs the momentum may change in a bullish favor because, on the 4-hour timeframe, the RSI has done a higher low.
MACD: The MACD on the daily timeframe remains bearish and continues to fall. However, similar to the RSI, the histogram of the MACD on 4-hour shows that the selling momentum is fading. These are early signs that SHIB may prepare an attempt to break away from the descending triangle.
Bias
The bias is neutral at this moment and will change when the SHIB price breaks away from the current formation in blue. There are some early signs SHIB can break and turn bullish, but it is too early to confirm this now.
Short-Term Prediction for SHIB Price
Expect to see a break of this formation in the next few days. So long, the SHIB price maintains a higher low in the current structure, the bias could change to bullish very soon. This can be confirmed if SHIB breaks away from the blue triangle and makes it support.


