Shiba Inu Price Analysis: After Losing 25% Monthly, SHIB Could Drop Much Lower
After failing to maintain the critical support level, Shiba Inu’s native token crashed and is on a path to setting a new local low.
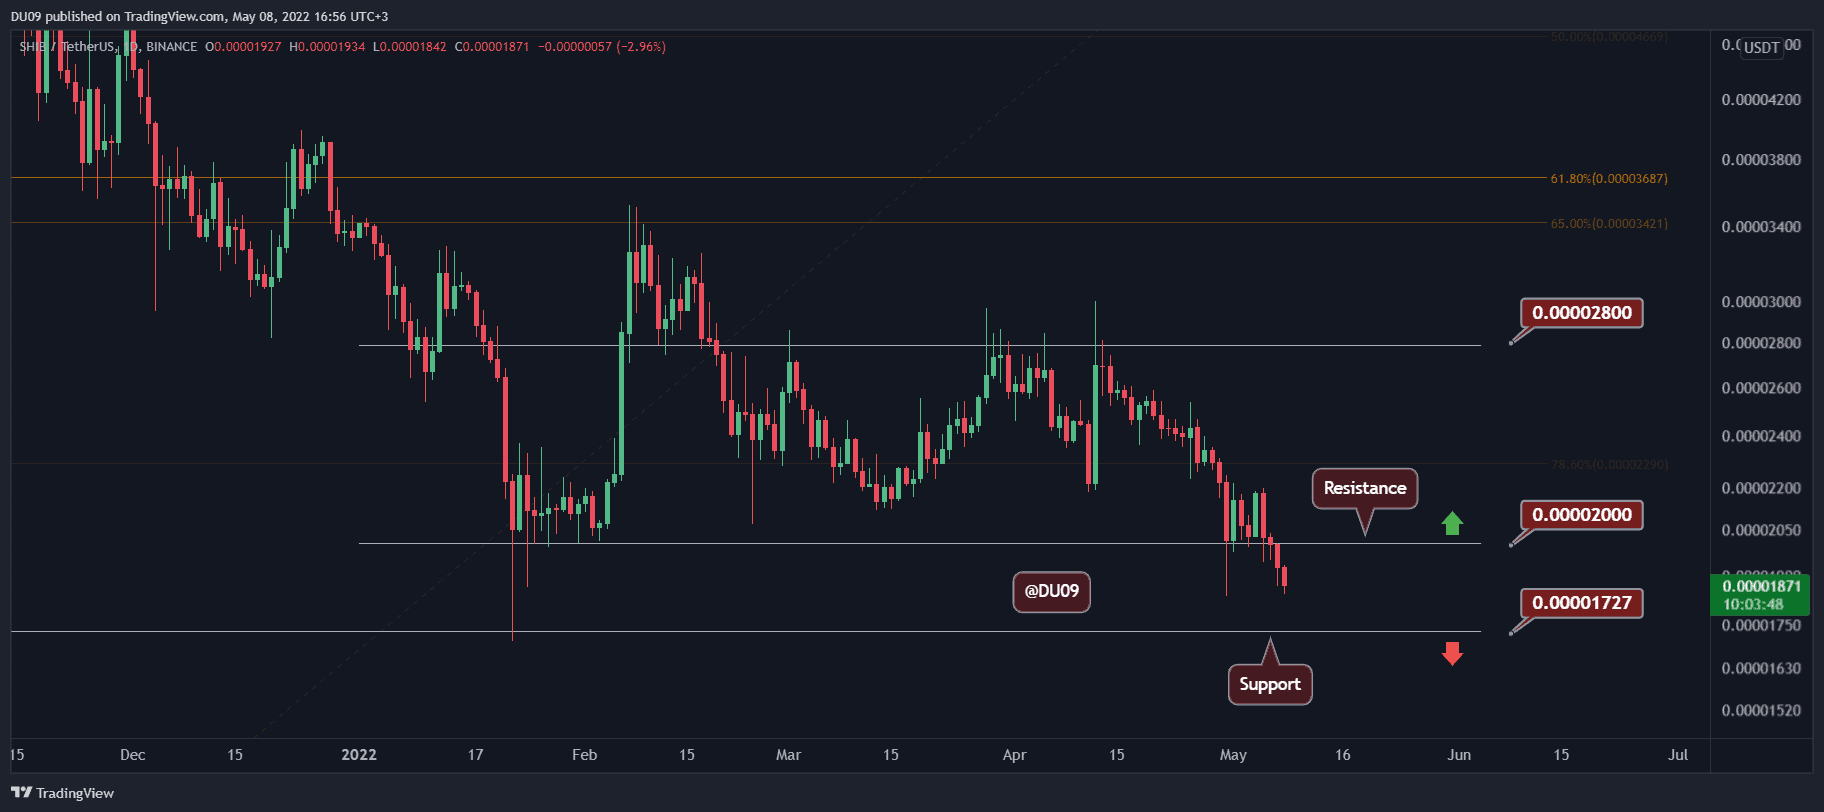
Key Support level: $0.000017
Key Resistance level: $0.000020
The support at $0.000020 turned into solid resistance on Saturday and today’s price action confirmed the breakdown with another daily red candle. The next key support is found at $0.000017 and SHIB, heading there, could find a temp relief upon reaching the support level.
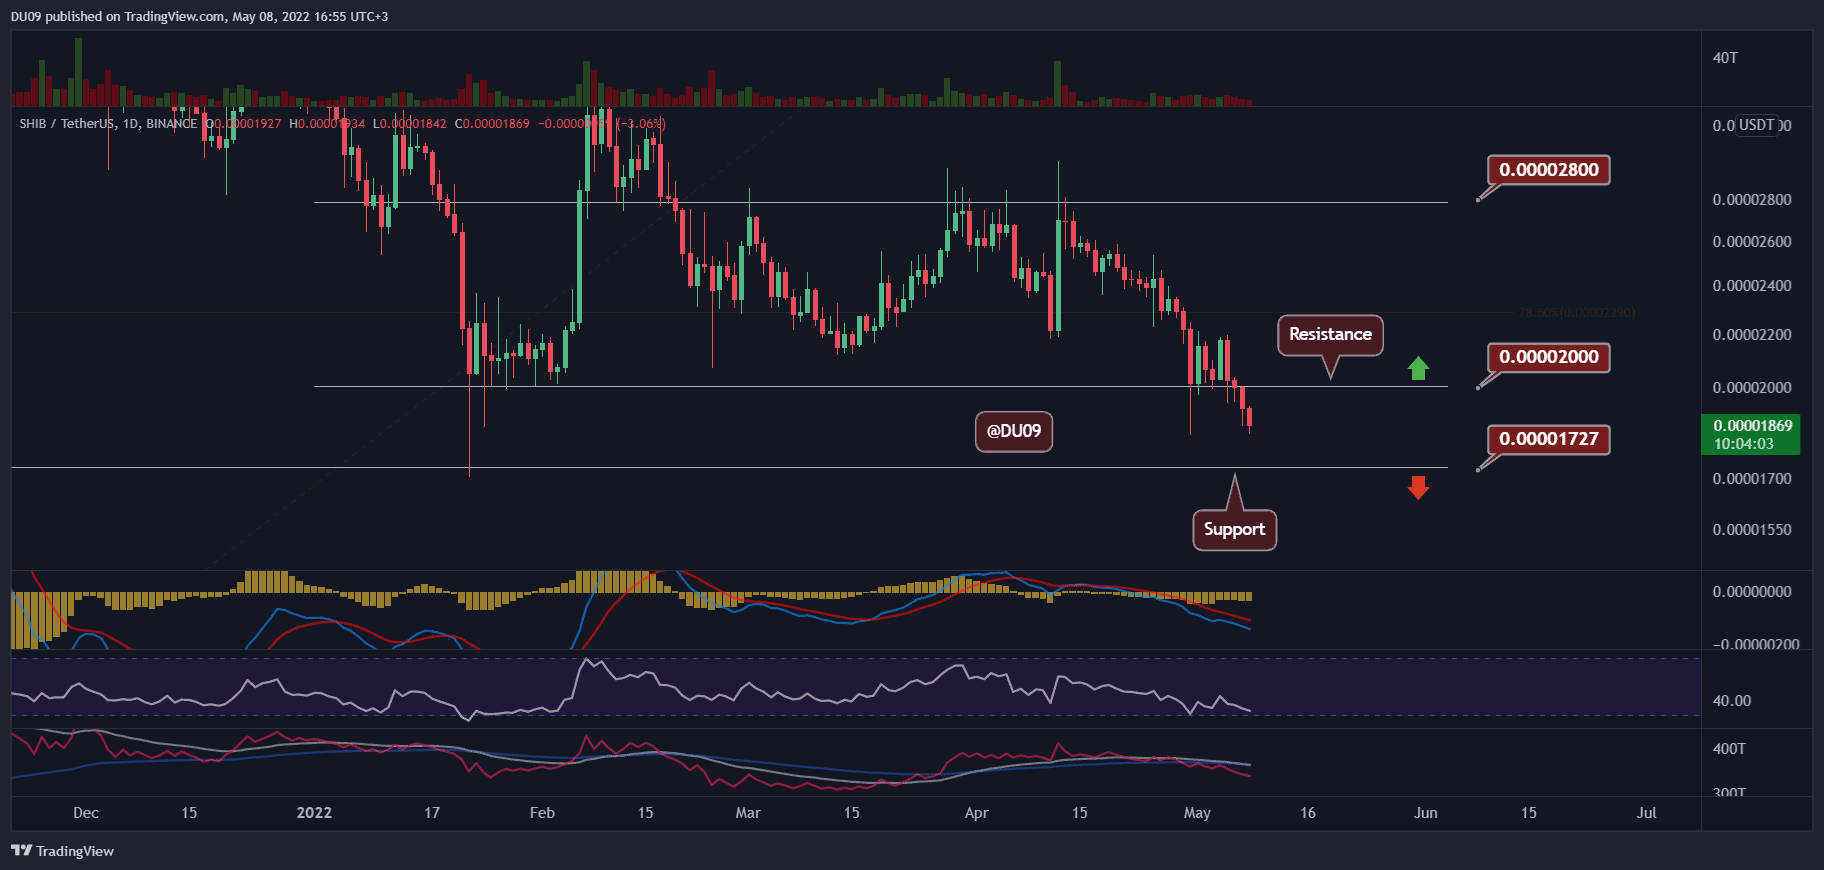
Technical Indicators
Trading Volume: The volume decreased as the price dropped. Generally, this is a bullish signal, but considering the overall bearish market conditions, it is better to wait for a reversal confirmation.
RSI: The daily RSI is quickly approaching the oversold area again (under 30 points). The last time it reached there, SHIB’s price bounced higher from this area.
MACD: The daily MACD is bearish, and the selling momentum is increasing, in contrast to volume. So long this continues, a reversal for SHIB is unlikely to occur.
Bias
The bias on SHIB is bearish.
Short-Term Prediction for SHIB Price
The indicators paint a rough short-term future for SHIB and price is likely to retest $0.000017 before any possible bounce. Best to be patient for SHIB to find a local bottom before jumping in.