SHIB Rollercoaster Continues Following 25% Daily Plunge, What’s Next? (Shiba Inu Price Analysis)
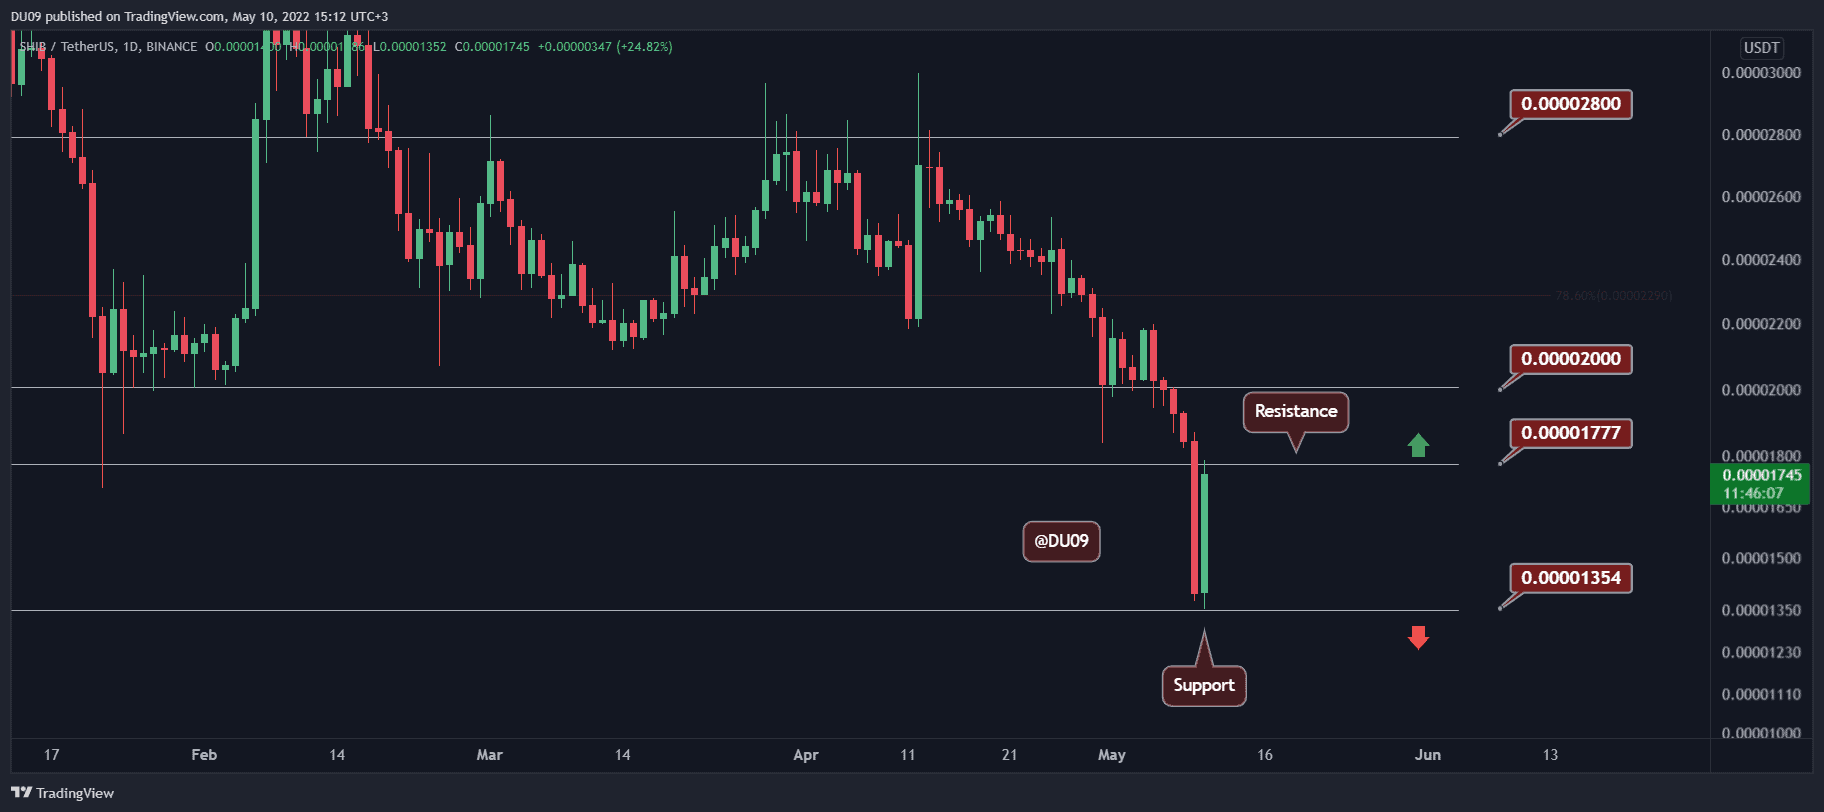
Key Support level: $0.000013
Key Resistance level: $0.000017
SHIB crashed hard yesterday during the market panic, with the price losing 26% in one day. This was triggered by the loss of support at $0.000017, which is now acting as resistance. In the process, SHIB has found some relief at the $0.000013 level.
Technical Indicators
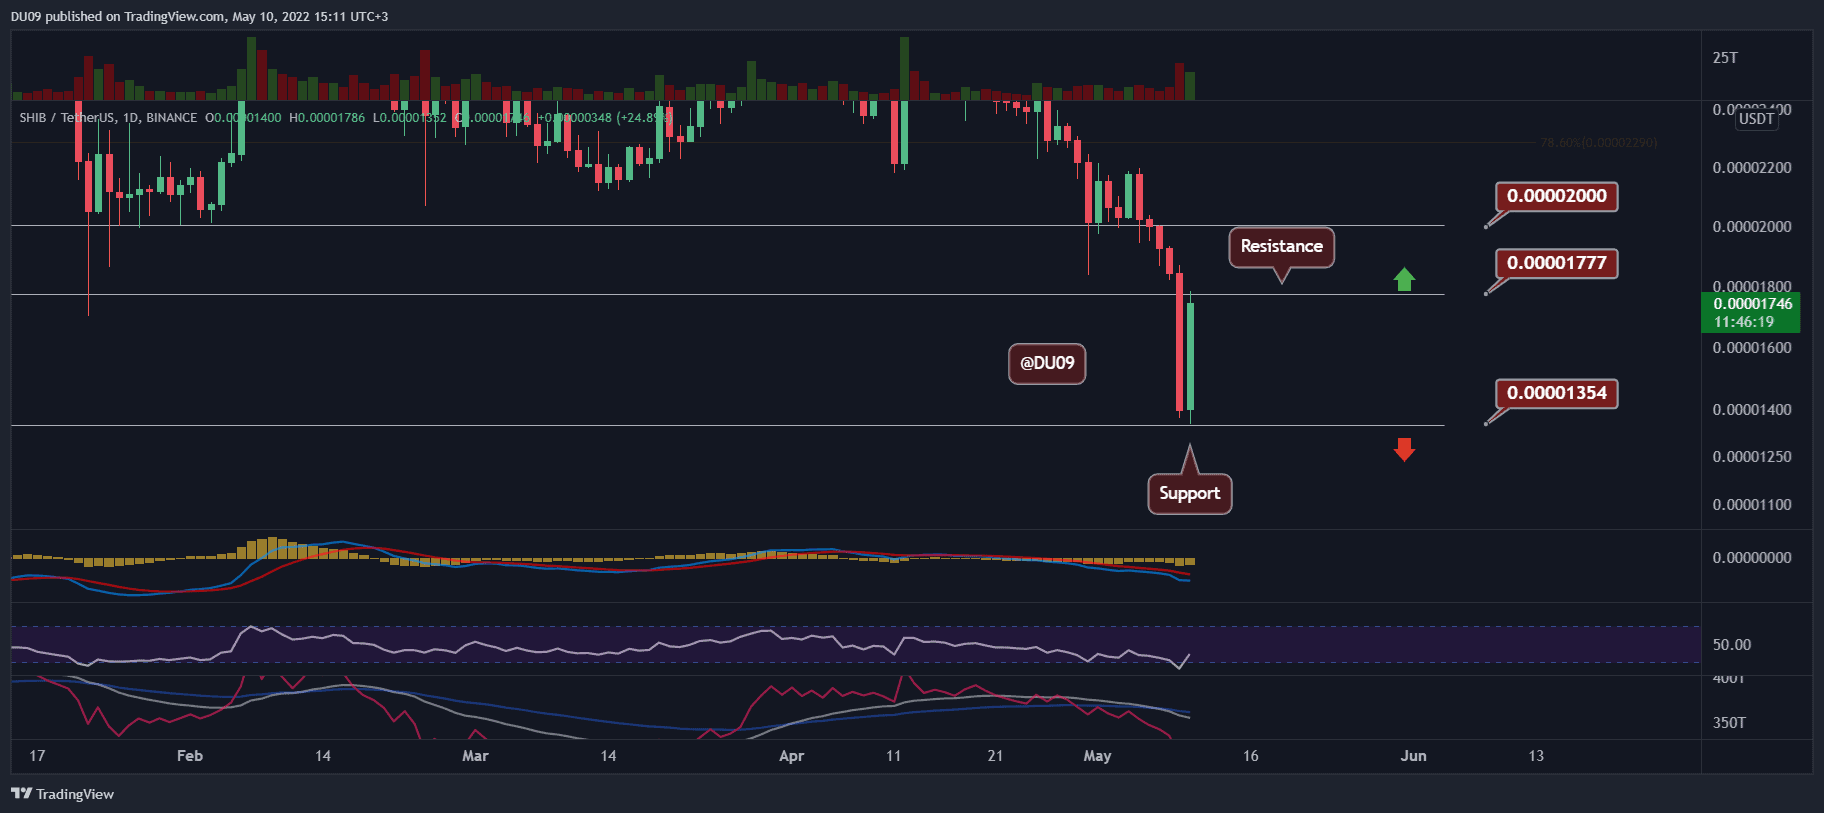
Trading Volume: The volume exploded during the crash yesterday and remains high. Best to be prepared for more volatility this week.
RSI: The daily RSI fell into the oversold area at 21 points and has now bounced to 38. Until it reaches 50 points or makes a bullish divergence, it is hard to be positive.
MACD: The daily MACD is bearish, and the histogram made a lower low yesterday. So long as this continues, the bias will remain bearish.
Bias
The bias on SHIB is bearish.
Short-Term Prediction for SHIB Price
While this most recent bounce is impressive, SHIB needs to break the key resistance and move higher to sustain any possible recovery. If it can move above $0.000017 and then $0.000020, the outlook will improve substantially.