SHIB Rallies 14% Weekly But Warning Signs Flash: 3 Things to Watch This Week (Shiba Inu Price Analysis)
SHIB appears at a crossroad as the price is quickly losing its bullish momentum.
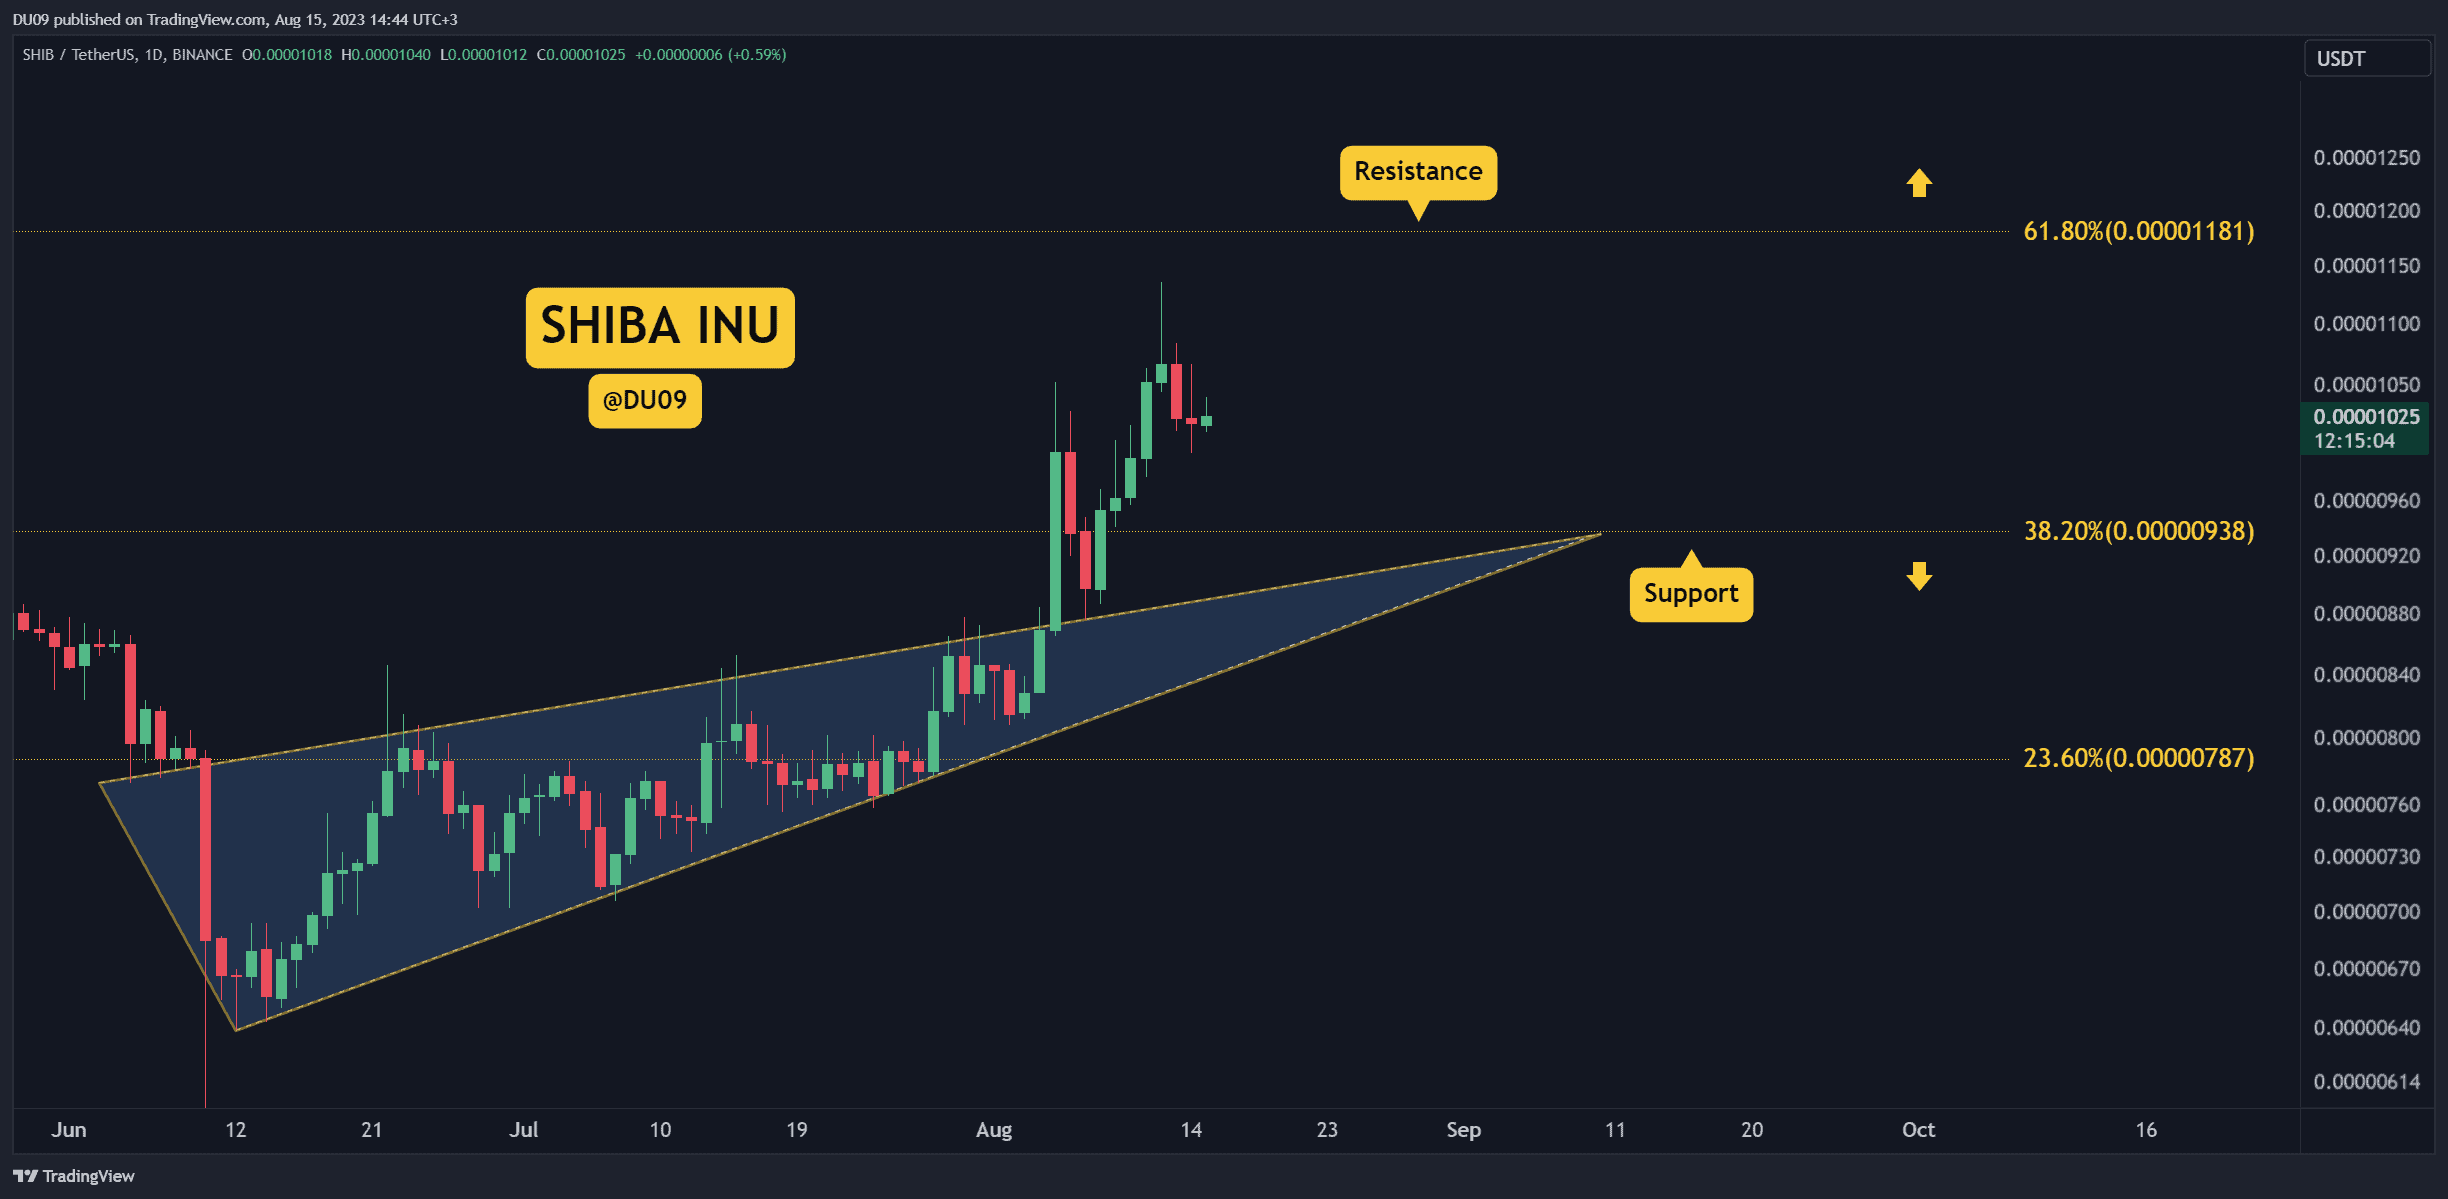
Key Support levels: $0.000010; $0.000094
Key Resistance levels: $0.000012
1. Rejection under Key Resistance
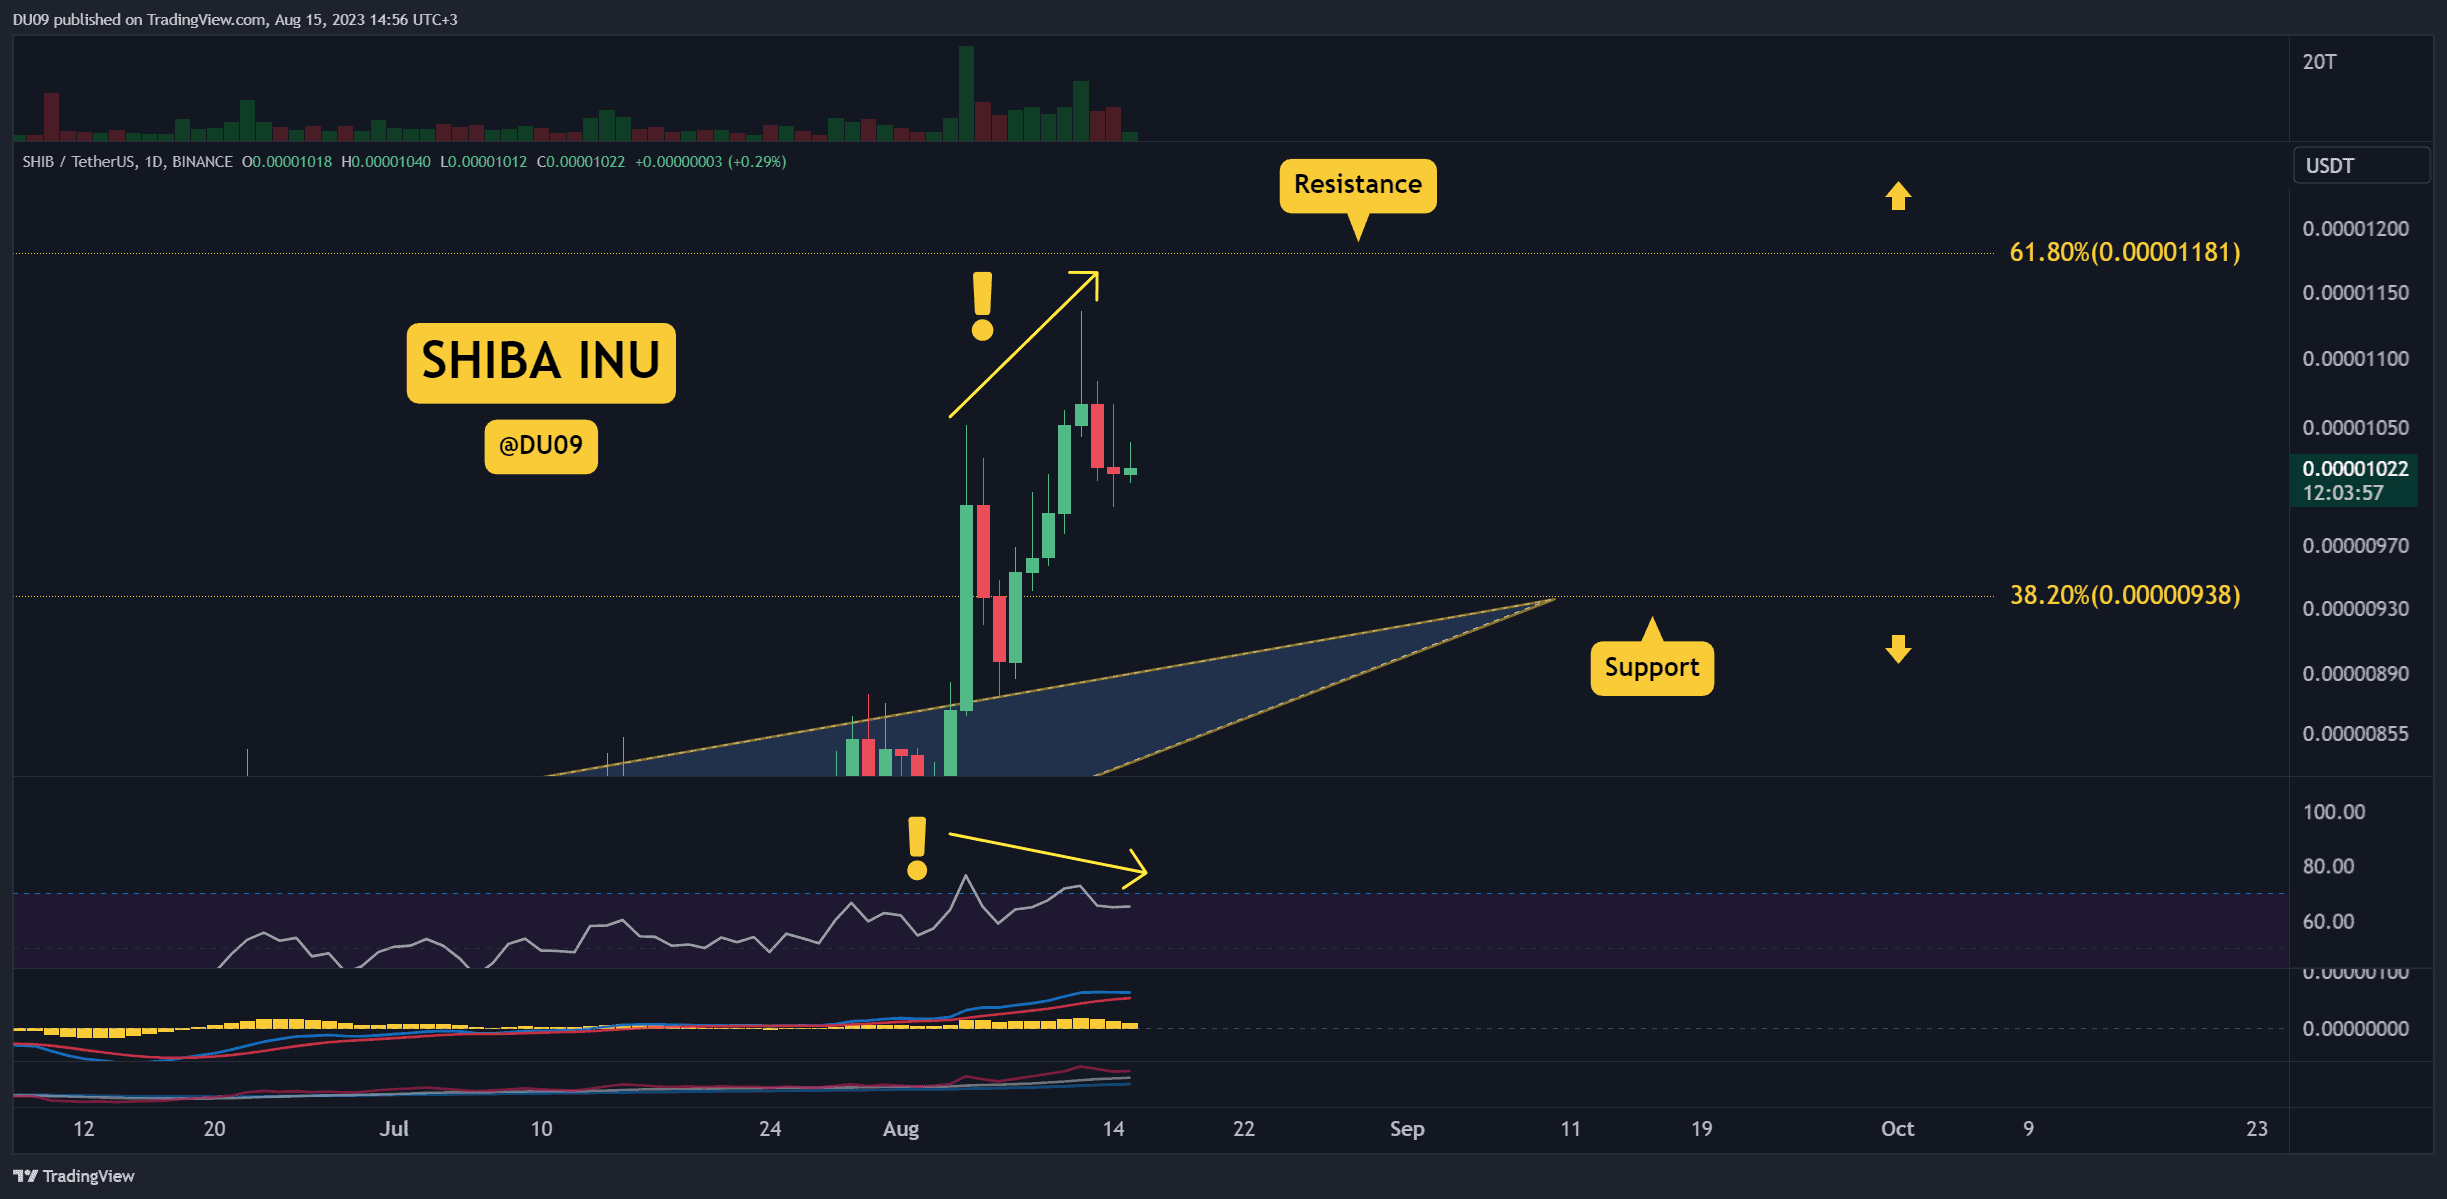
The rally continued until Sunday when the price started to fall. This is the first time in over a week when sellers showed strength and were able to stop the rally. If this continues, then SHIB may enter a correction.
2. Bearish Divergence
The daily RSI is showing a clear bearish divergence. The price made a higher high, while the RSI momentum indicator made a lower high. This shows that bulls are starting to lose control over the price.
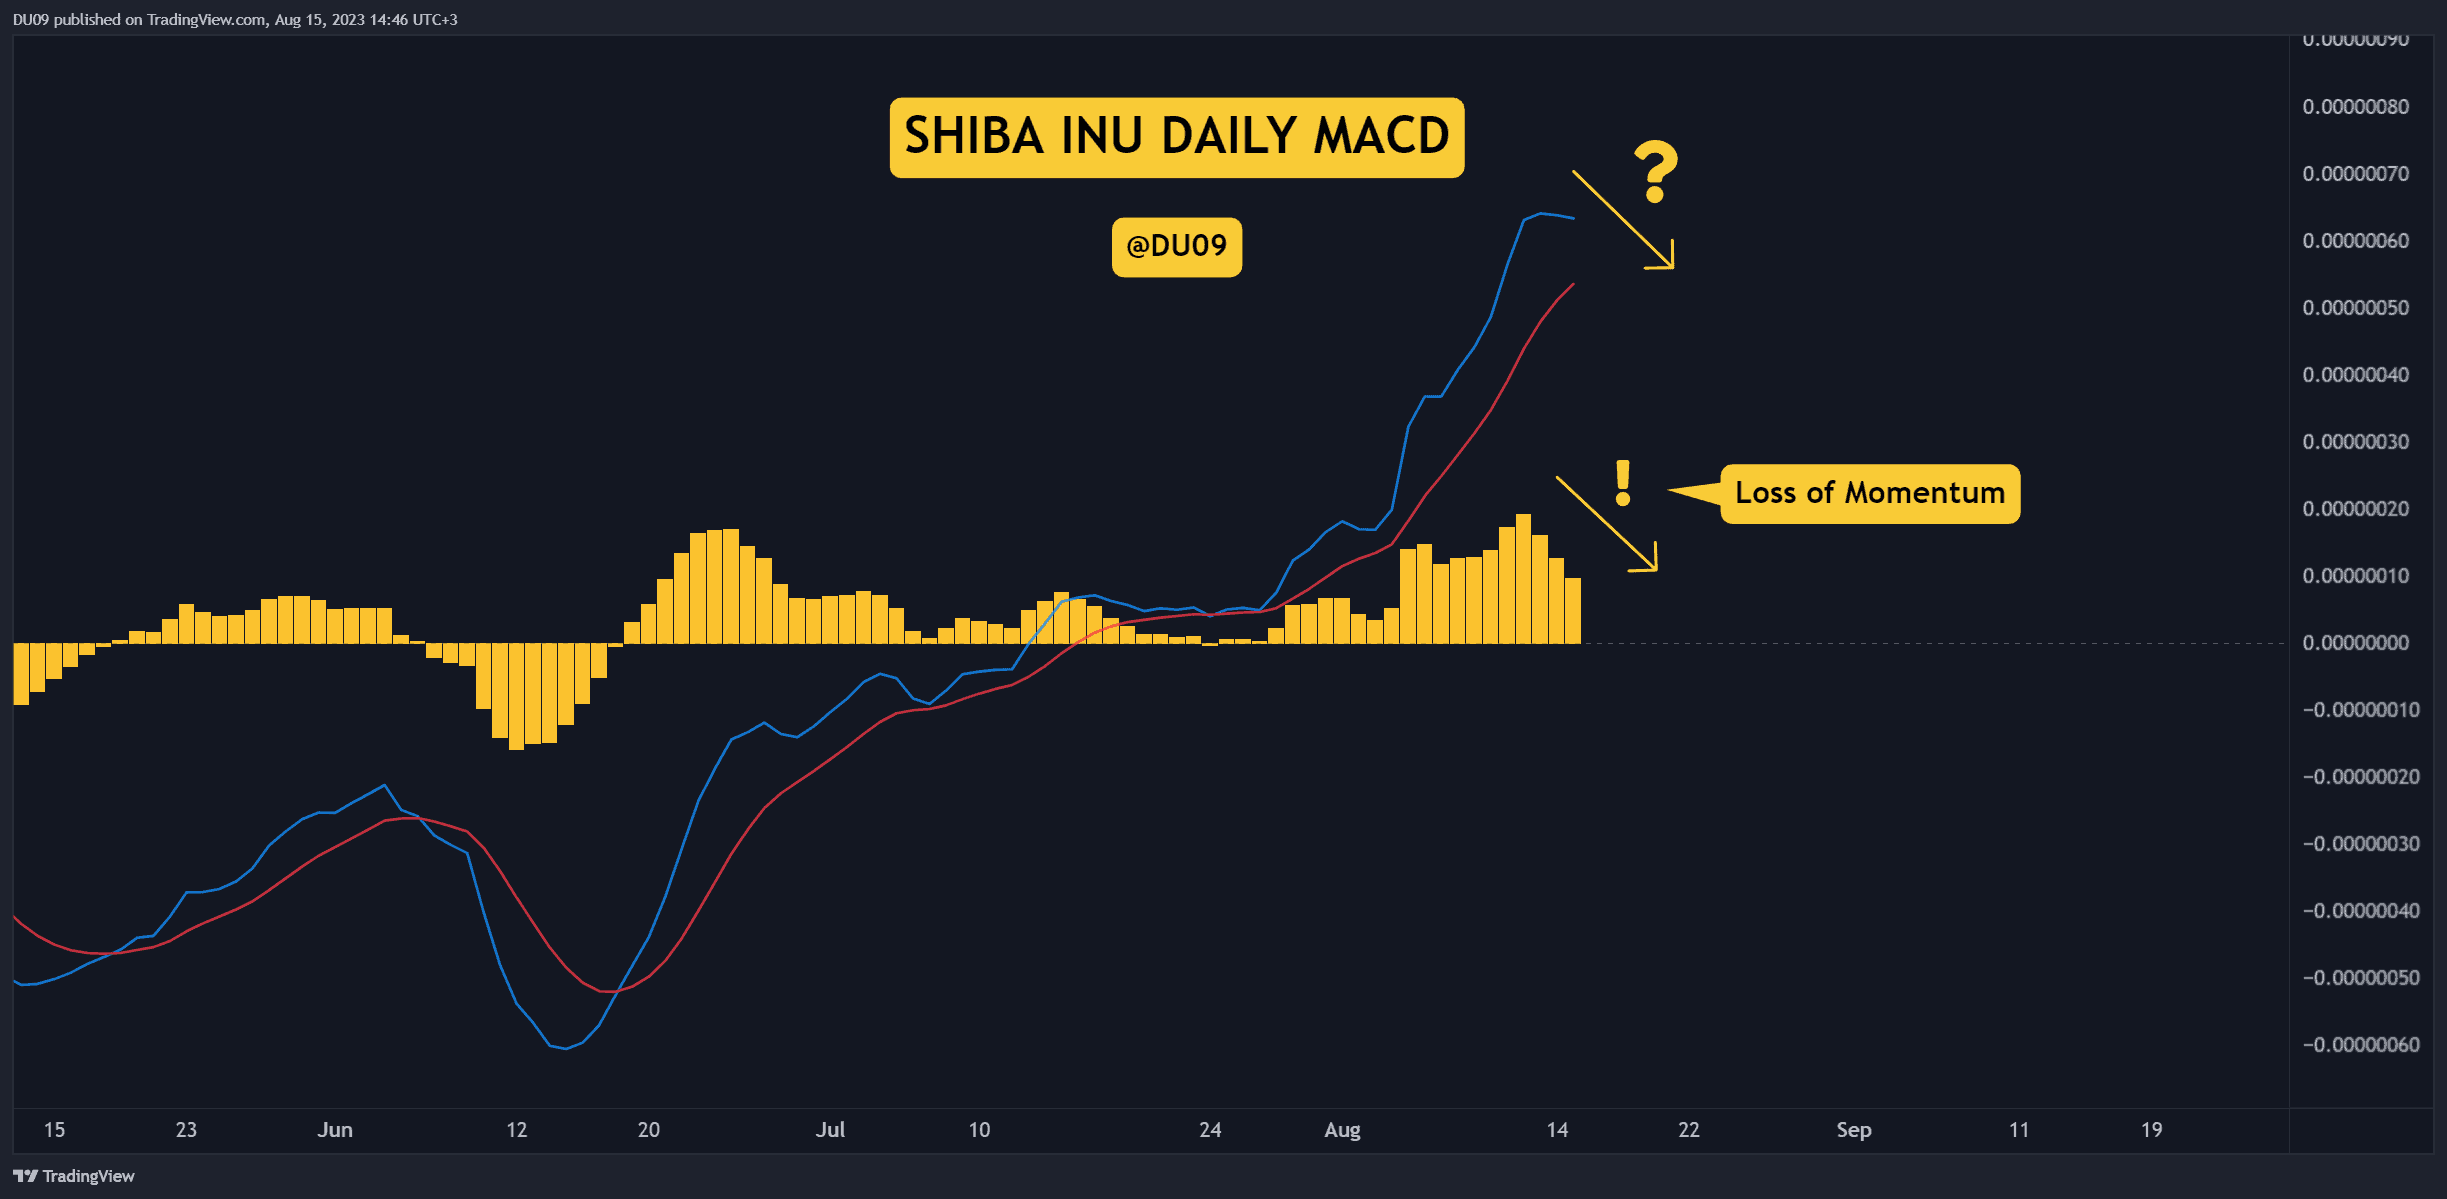
3. Momentum Shifting Bearish?
Similarly to the RSI, the MACD histogram has been making lower highs for four days. This is a clear warning sign that momentum may soon change if buyers don’t return soon.
While a bearish cross is still some distance away, this price action may encourage sellers to step up their pressure.
Bias
The bias for SHIB is neutral.
Short-Term Prediction for SHIB Price
Even if a correction unfolds this week, SHIB has good support at $0.000010 and $0.000094. Only if these levels fail to hold would the price action turn bearish. The resistance remains at $0.000012.
The post SHIB Rallies 14% Weekly But Warning Signs Flash: 3 Things to Watch This Week (Shiba Inu Price Analysis) appeared first on CryptoPotato.