SHIB Crashes 15% Weekly But How Low Can It Go? (Shiba Inu Price Analysis)
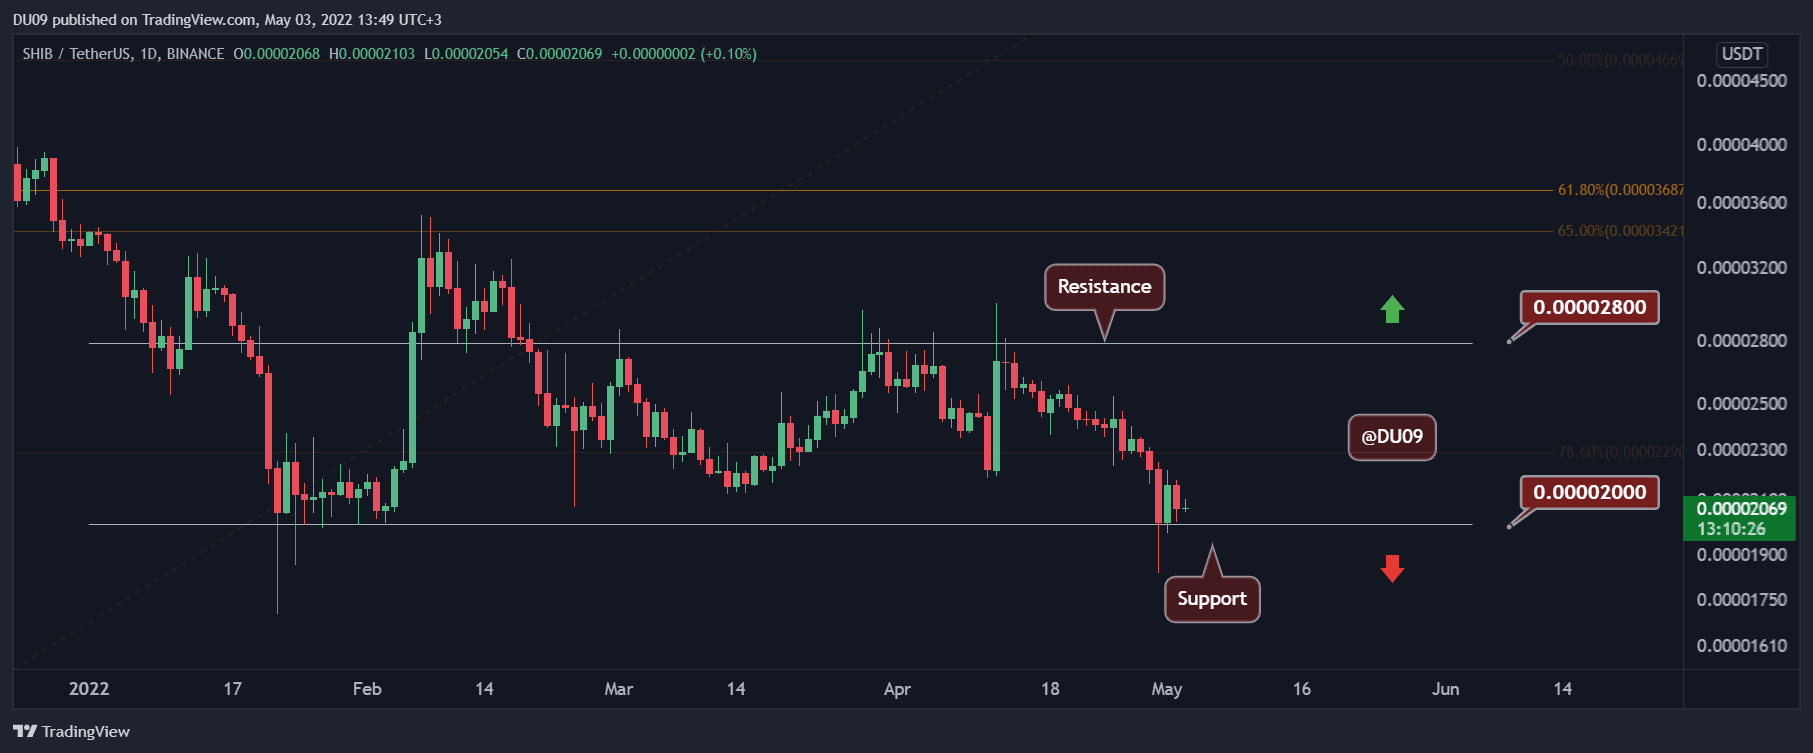
Key Support level: $0.000020, $0.000017
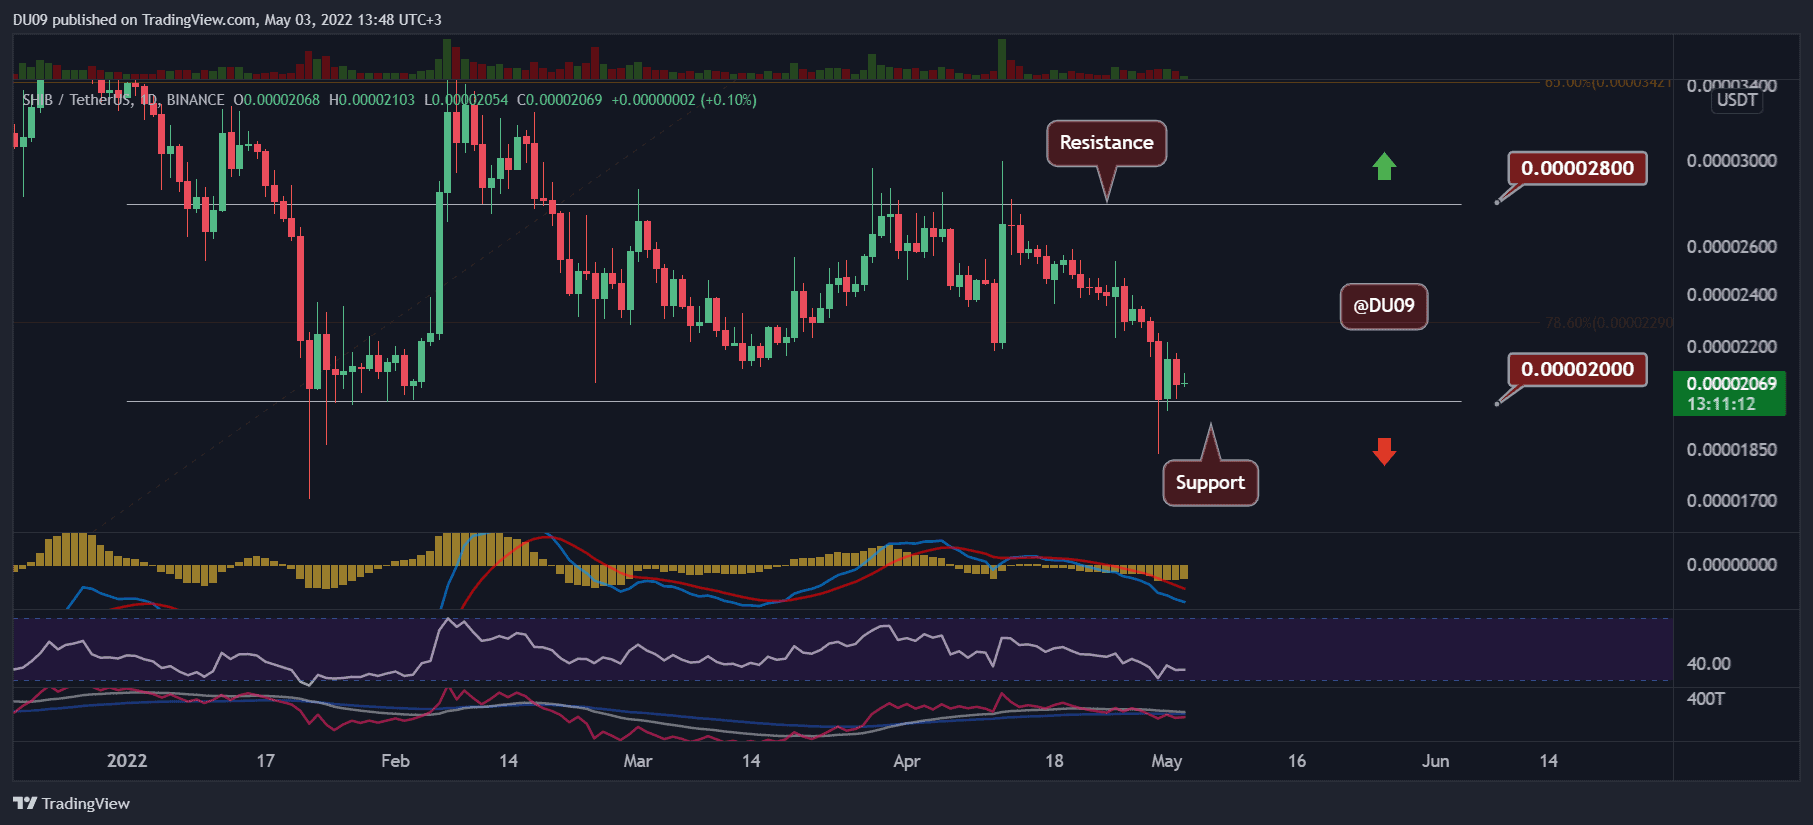
Key Resistance level: $0.000028
SHIB failed to rally and returned to the key support at $0.000020, which so far has managed to save the price from a significant crash. In the past, this level held strong and managed to take SHIB higher to the key resistance found at $0.000028.
The indicators remain bearish on higher timeframes, and bulls have a difficult task ahead in trying to hold off the selling pressure.
Technical Indicators
Trading Volume: The volume remains low and appears to favor bears at the time of this post since they have dominated the chart in the past month.
RSI: The daily RSI is making lower lows and has yet to reach the oversold area at 30 points. This indicates SHIB could continue to fall lower until a bottom is found.
MACD: The daily MACD is bearish, but the selling momentum appears to be flat in the past few days. The big question is if bulls will attempt a reversal here.
Bias
The bias on SHIB is somewhat neutral as long as the price holds above the key support, but the indicators don’t inspire confidence for bulls.
Short-Term Prediction for SHIB Price
SHIB bulls must defend $0.000020. Failing to do so would be a major issue and could propel the cryptocurrency further down towards $0.000017.