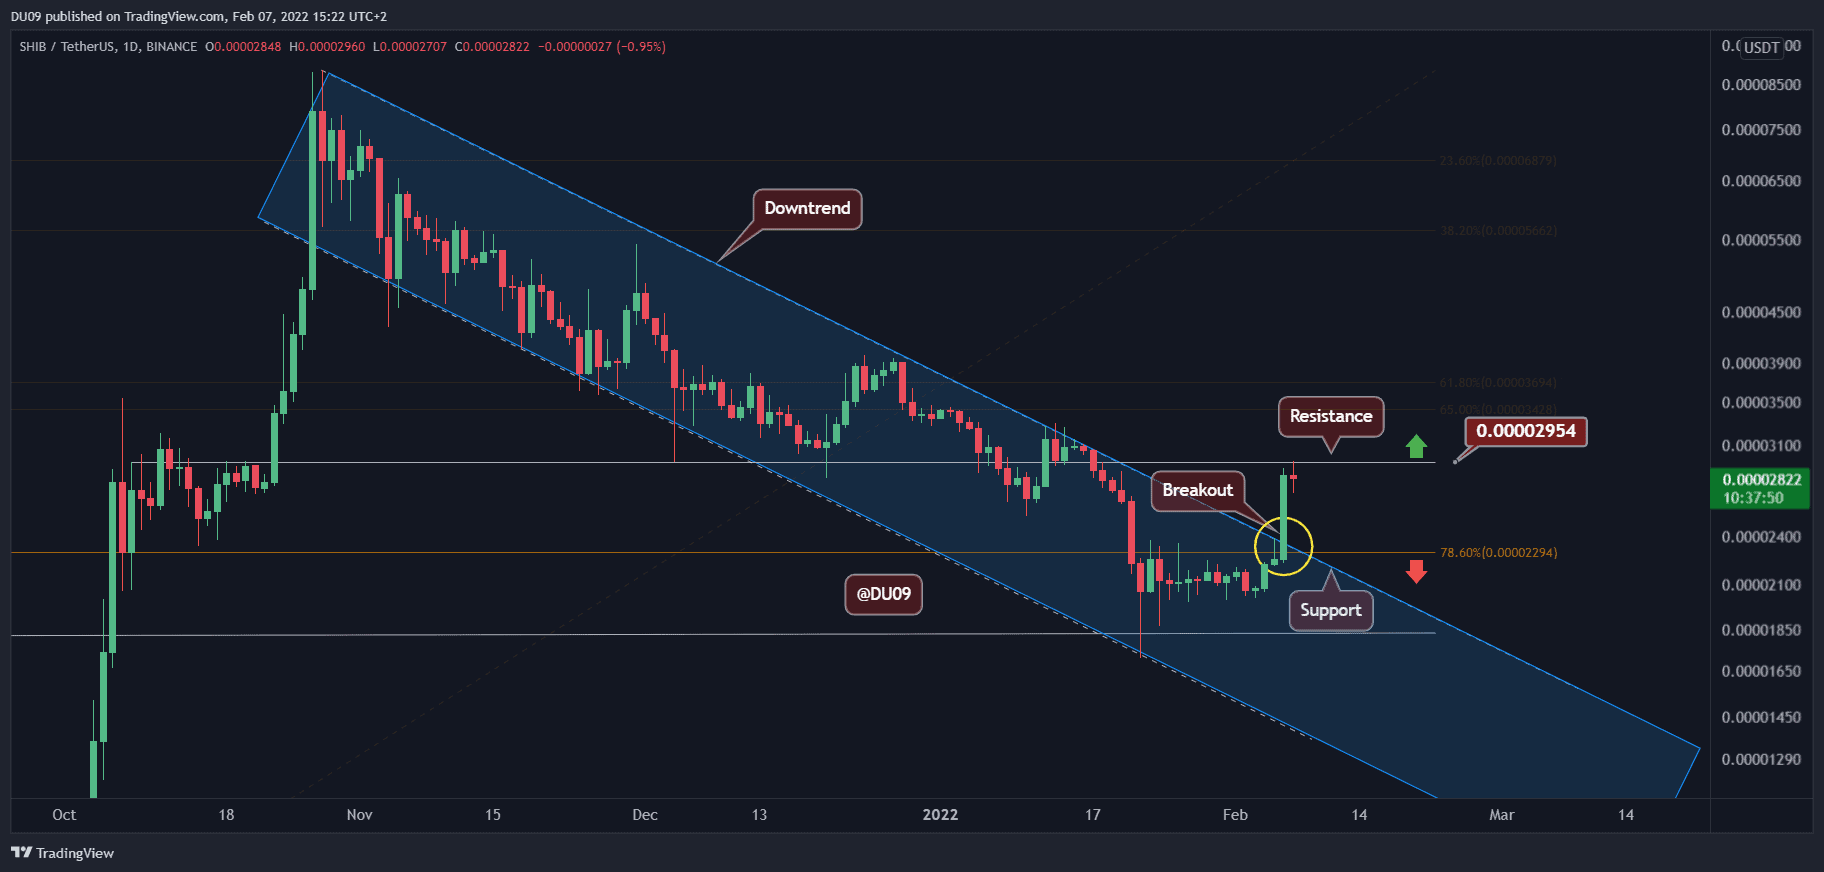
SHIB Breaking Out Huge Resistance, Here is The Next Target
Key Support level: $0.000023
Key Resistance levels: $0.000030
As indicated yesterday, SHIB closed in on the key resistance at $0.000023, which has now been firmly broken and turned into support. Once the price moved above this key level, the volume exploded, and the cryptocurrency rallied towards $0.000030, which is now acting as new resistance.
This breakout ends the downtrend, which has lasted since November 2021. The big question now is if SHIB can make a higher high or move beyond $0.000032.
Technical Indicators
Trading Volume: The volume increased dramatically yesterday after the price broke above $0.000023. This hasn’t been seen since the crash in January.
RSI: The daily RSI has made a higher high and went from 30 points to 60 points in less than a week. This may mean a pullback is likely in the future due to profit-taking.
MACD: The daily MACD is bullish and moving higher at a fast pace. This latest increase in price only reconfirms the bullish bias. SHIB can continue up for quite a while based on the MACD, and this latest move appears like a significant reversal in the previous trend.

Bias
The bias on SHIB is bullish. This latest breakout confirms a trend reversal.
Short-Term Prediction for SHIB Price
While SHIB may now consolidate just under the key resistance at $0.000030, the price has broken away from the downtrend, and this is a significant change in the market. If SHIB manages to make a higher high, then a sustained rally can be expected, depending on overall conditions.