SEC Likely to Approve Several Spot ETFs, Sparking Next Bitcoin Rally: Matrixport
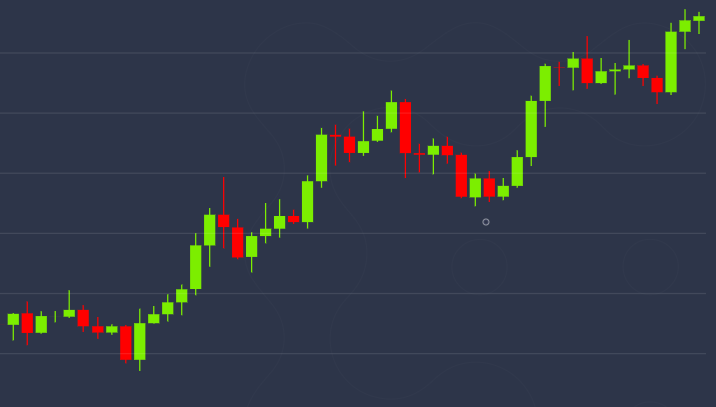
The U.S. Securities and Exchange Commission is likely approve several spot bitcoin (BTC) exchange-traded funds in quick succession, triggering the next move higher for the world’s largest digital currency, crypto-services provider Matrixport said in a report Thursday.
The ETF providers would spend “considerable marketing expenses to draw in retail and institutional capital,” Markus Thielen, head of research, wrote.
Matrixport noted that at its peak, the Grayscale Bitcoin Trust (GBTC) managed $43.5 billion in assets and generated annual management fees of $870 million.
The SEC will respond to Grayscale’s GBTC lawsuit filing and ARK 21Shares bitcoin ETF refiling, next week. The regulator is expected to respond to seven other bitcoin ETF filings during the first week of September.
“A physical bitcoin ETF will likely carry a management fee of 0.7-1% which could still bring in $200m per annum for those ETF providers with marketing expenses front-loaded,” the report said.
The note said that any SEC spot ETF approval could have a “material positive impact” on bitcoin’s price, and investors should have enough “upside exposure” on any day that the regulator is scheduled to respond to the ETF applications.
If the SEC needs more time to assess the practicality of the surveillance-sharing agreements, then the bitcoin price may correct initially in mid-September, and this is the “dip to buy,” the report added.
CoinDesk’s parent company, Digital Currency Group, owns Grayscale.
Edited by Aoyon Ashraf.

