Safe Haven? Bitcoin’s Recent Rally Correlated With Gold And Silver
Over the year so far, Bitcoin has demonstrated interesting correlations with legacy markets. During the crash, largely-induced by the spread of the novel coronavirus and for a period after that, the cryptocurrency was trading in line with the stock market.
Now, however, it appears that Bitcoin is largely perceived as a safe haven as it demonstrates a massive correlation with gold and silver.
BTC Correlation with Gold at an All-Time High
Observing the way Bitcoin transacts is particularly interesting from a range of viewpoints. Its correlation with legacy markets has been long noted.
This time around, however, it appears that the leading cryptocurrency is largely correlated with gold and silver.

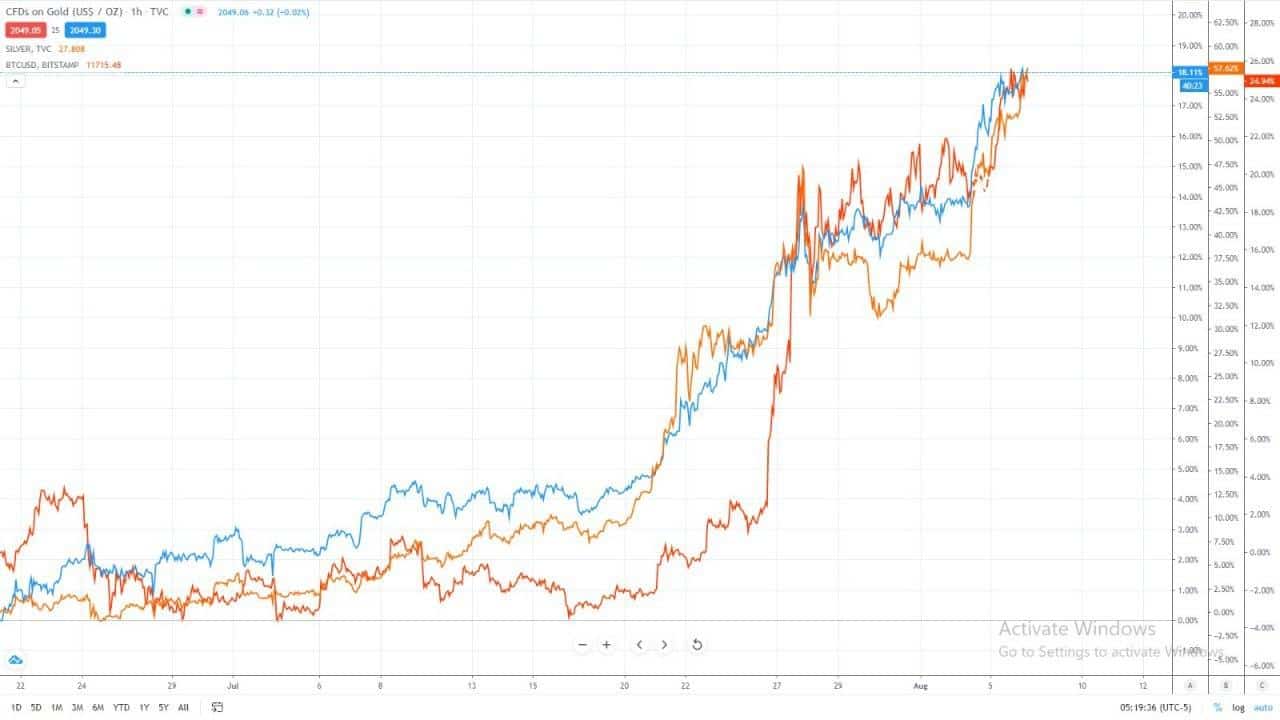
As seen in the above chart, Bitcoin’s price and that of gold and silver have been acting in almost the same way for the past couple of weeks – during BTC’s latest rally.
As CryptoPotato reported yesterday, gold prices hit a new all-time high above $2,000. The precious metal has been performing very impressively throughout the entire year and especially after the mid-March market tumbles. It has managed to increase its dollar value by almost 40% since then.
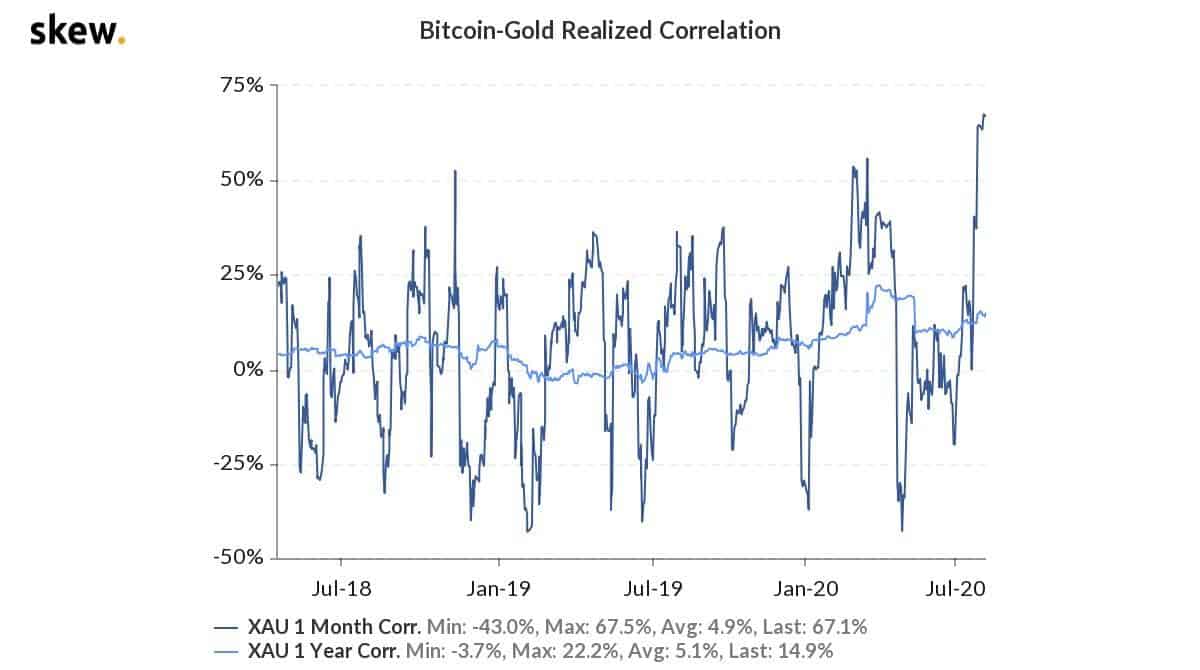
Data from Skew also shows that the realized correlation between Bitcoin and gold is at an all-time high.

The investor profile for both assets, however, remains notably different, according to recent research compiled by the banking giant JPMorgan.
Nikolaos Panigirtzoglou, a strategy team lead at the bank, concluded that baby boomers (people born between 1946 and 1960) are focused on investing in gold and government bonds – assets, typically known to be “safe” and less volatile.
On the contrary, younger generations are allocating greater amounts in assets considered to be riskier – namely stocks and Bitcoin.
Is Correlation Good for BTC?
Many consider Bitcoin moving in line with gold as a positive sign. Indeed, taking into account some of the characteristic fundamentals of both assets, this might be true.
Both Bitcoin and gold are scarce – there’s only so much of both assets that will ever exist. This makes it more reasonable for people to hold Bitcoin rather than to sell it because its value should go up, provided the demand for it remains the same, or increases over time.
Bitcoin proponents support this thesis, predicated on the fact that there are plenty of industry actors working tirelessly to bring awareness and further adoption for the cryptocurrency.
On the other hand, however, this is in a direct contradiction of what Satoshi Nakamoto, the pseudonymous creator of Bitcoin, intended for the cryptocurrency. Called Bitcoin: A Peer-to-Peer Electronic Cash System, some would argue that the original intention of the cryptocurrency is to be used as a means of exchange.
The whitepaper itself reads that BTC is “a purely peer-to-peer version of electronic cash (that) would allow online payments to be sent directly from one party to another without going through a financial institution.”
Right now, however, there’s little to no incentive to spend BTC, given the constant printing of fiat currency that will eventually end up devaluing it. In other words, why would someone want to spend BTC, the value of which should only increase given its inherent scarcity, while the USD and other currencies are being massively inflated?
The post Safe Haven? Bitcoin’s Recent Rally Correlated With Gold And Silver appeared first on CryptoPotato.


