Ripple XRP Price Analysis Nov.23: Key support level reached. Reversal coming up?
Having reached a high of 10500 Satoshi this week, Ripple-Bitcoin market has been choppy, and trading tightens between 9800 – 9500 Satoshi on the Medium-term outlook.
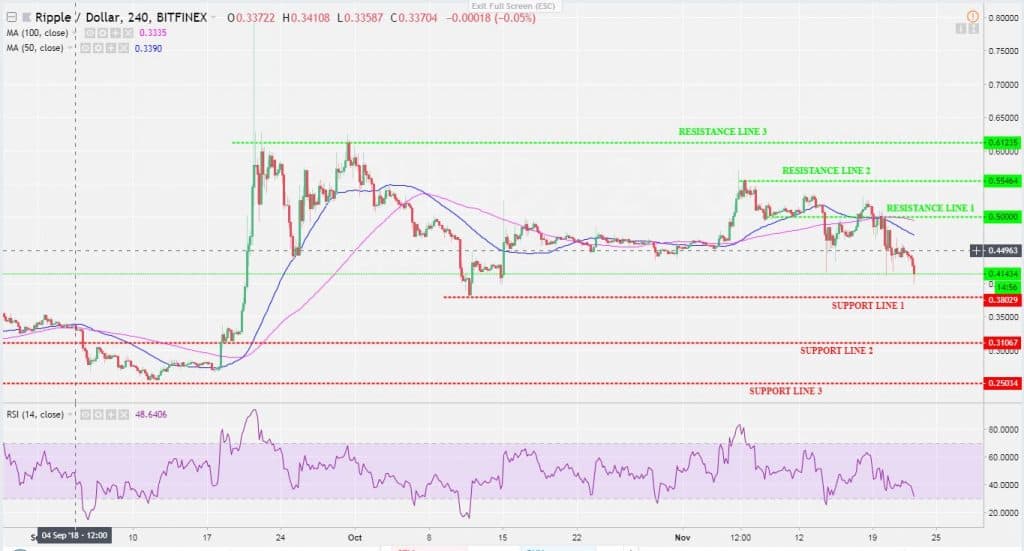
As against Dollar, Ripple’s price nears $0.38 as its market structure appears in a bearish formation since earlier this month and following market’s sentiment.
XRP-USD Market
On Wednesday, Ripple had a high trading volume of over $1.5 billion and a market cap of over $17.5 billion. Today, its trading volume is as low as $635 million with $16.5 billion market cap approximately. Though, it is still positioned as the number two biggest cryptocurrency ahead of Ethereum.
Looking at the 4 hours chart, XRP had a peak of $0.55 on November 6. The current price is currently swinging to $0.38 horizontal support level (1).
A retracement may trigger at a touch of the support above to re-test $0.5 resistance before a bounce back down. Or perhaps a trend reversal at the above support ($0.38) as it further drives up the resistance levels in an uptrend.
XRP/USD market, however, remains bearish, following the general environment around the Bitcoin during the past week.
Key levels
Resistance: $0.50, $0.55, $0.61 | Support: $0.38, $0.31, $0.25
XRP/Dollar BitFinex 4-Hours Chart

XRP-BTC Market
As mentioned before, Ripple has been doing a good job being a hedge to the declining Bitcoin.
Advancing in a higher lows pattern, to the peak of 10,500 three days ago. Right after, a bearish engulfing candle formed, resulting in consolidation and building a robust red candle might send Ripple to a bottom of 8500, 8000 and 7200 SAT support levels, in case of breaking the descending trend-line around these levels of 9500 Satoshi.
The 4 hours RSI lies below the overbought territory: might signal for a decline (a possible trend reversal).
XRP/BTC Binance 4-Hours Chart

Cryptocurrency charts by TradingView. Technical analysis tools by Coinigy.
The post Ripple XRP Price Analysis Nov.23: Key support level reached. Reversal coming up? appeared first on CryptoPotato.


