Ripple XRP Price Analysis Nov.21: Is XRP the ultimate hedge-altcoin against Bitcoin’s decline?
Following the recent news on Ripple and XRP, its management is clinching for ties with the Bank of America for a blockchain business to facilitating the cross-border transaction (Money Gram and Western Union) amongst crypto enthusiasts. The Asian Bank (CIMB) also shows interest in the Ripple-economy adoption as they prepare their customers to position for a peer to peer payment system. It is however believed that this might have influenced the surge in Ripple’s price yesterday. Or else, Ripple (and Stellar) might be a hedge for Bitcoin.
XRP-USD Market
A few days ago, Ripple overtook Ethereum’s position on the market cap as the second largest digital currency; currently trading with a volume of over $1.5 billion and a market cap of over $17.5 billion.
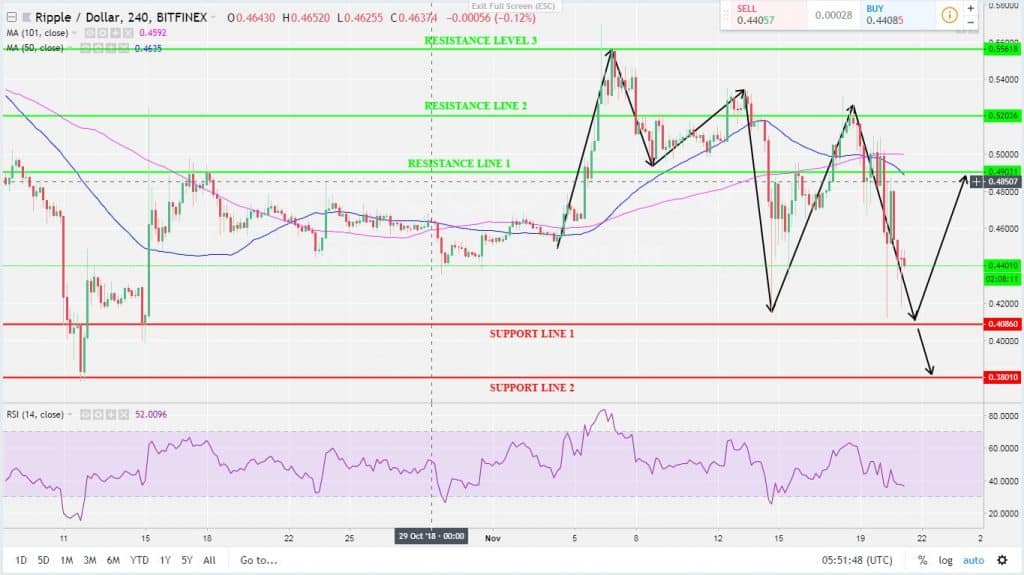
Nevertheless, the four hours chart shows trading frequently between the range of $0.53 and $0.40 price levels, whereas the general movement is a decline. As price nears support level 1 ($0.40), a retracement could be expected. Possible correction area is the resistance level 1 ($0.49). But in case the price breaks down the above support, the next support lies at $0.38.
XRP/USD market, however, remains bearish, following the general environment around the Bitcoin during the past week.
Key levels
Resistance levels: $0.49, $0.52, $0.55 | Support levels: $0.40, $0.38, $0.35
XRP/Dollar BitFinex 4-Hours Chart
XRP-BTC Market
Over the past two days, Ripple proved it’s currently the best altcoin to hedge against Bitcoin’s free fall. In its daily peak, it had reached 10,500 Satoshi mark and retraced quickly as Bitcoin corrected up.
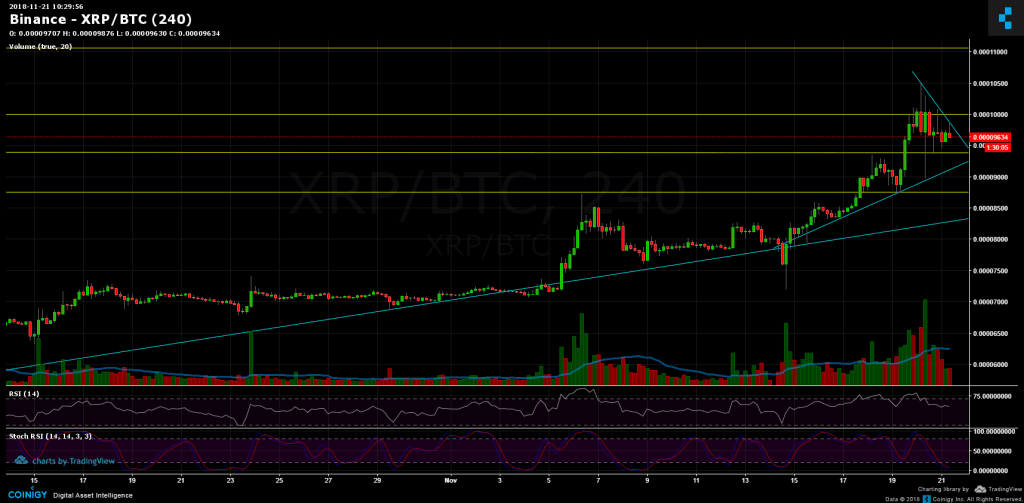
Looking at the following chart, From above Ripple has a descending trend-line to overcome to stay bullish, ahead of the 10,000 Satoshi resistance level. Behind lies 11,000 SAT resistance.
From the bear side, Strong support level at 9370 SAT, along with ascending trend-line. Breaking the above will send Ripple to re-test support levels at 8760 and 8300 Satoshi.
Stochastic RSI is at its lowest levels: might indicate that the market is oversold (a bullish short-term sign).
XRP/BTC Binance 4-Hours Chart
Cryptocurrency charts by TradingView. Technical analysis tools by Coinigy.
The post Ripple XRP Price Analysis Nov.21: Is XRP the ultimate hedge-altcoin against Bitcoin’s decline? appeared first on CryptoPotato.