Ripple XRP Price Analysis Nov.19: Ripple as a hedge against Bitcoin
To summarize, XRP is bearish against the USD, despite being a hedge for Bitcoin. Against the leading cryptocurrency, Ripple looks bullish and just recently surpassed Ethereum as the second largest crypto.
XRP-USD Market
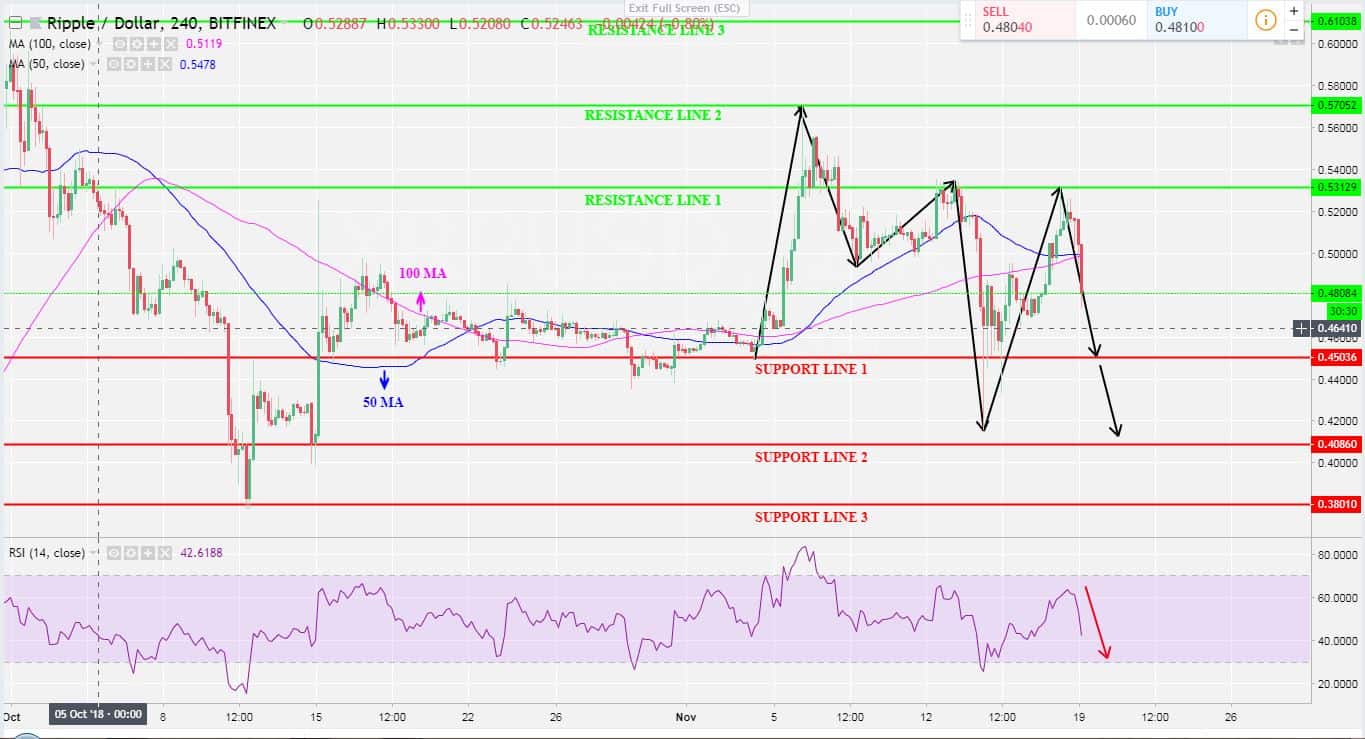
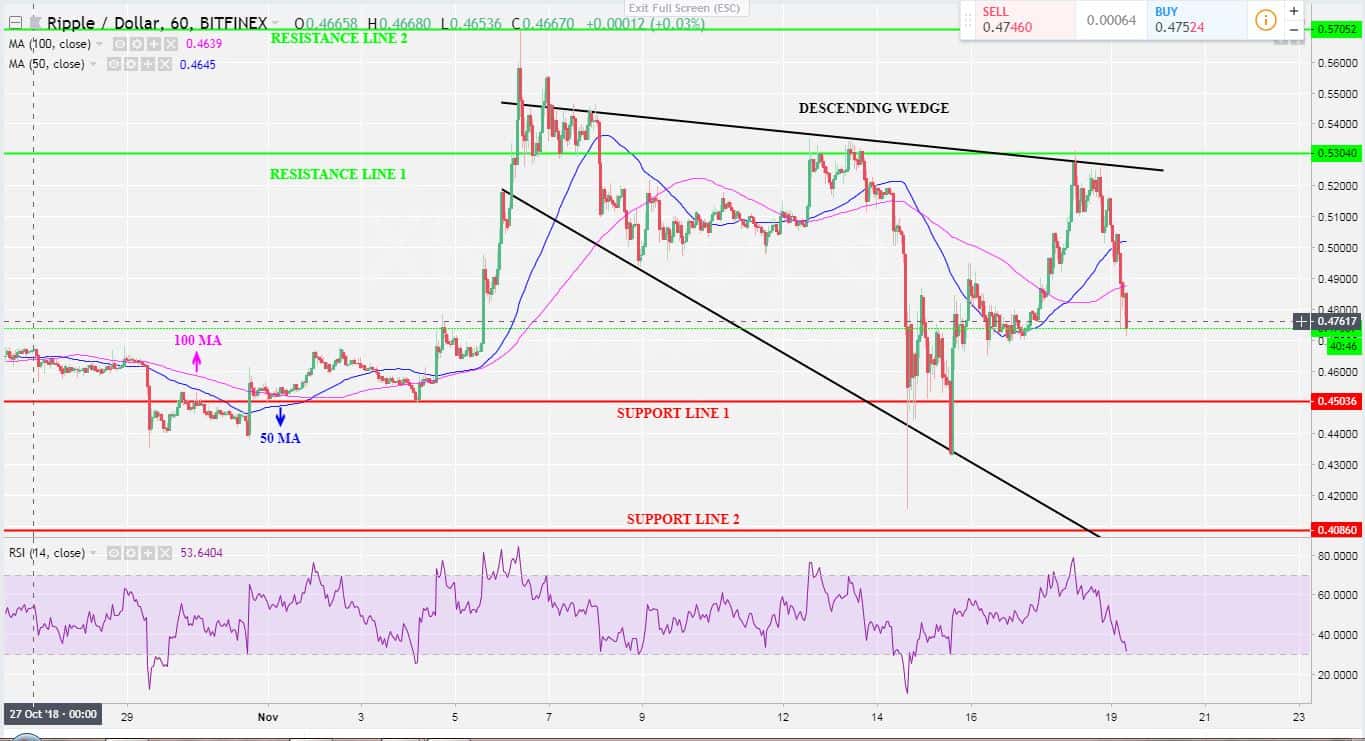
The XRP market is moving in a downward direction following high seller’s volume. A breakout may occur above $0.55 resistance level should the buyers react strongly with a demand force. This crypto will remain in a bearish trend, but a bullish run may rescue the market from the bears
The last twelve days have been recording a fall in the Ripple USD value. This is as a result of the selling pressure following the bearish crypto trend.
By looking at the Long-term trend, seems like the price is reaching for the significant $0.45 support level (1). A break of the above level and the next target can be the $0.40 support level (2) where the lower trend line lies. From the bullish side, the next major resistance lies at $0.53.
Also, the Relative Strength Index (RSI) period 14 is pointing to the low level of (40) which indicates that the market is close to the oversold zone. Concurrently, the Moving Averages 50 and 100 are equally reaching for a slope direction to signal a clear bearish trend.
Key levels:
Resistance levels: $0.53, $0.57, $0.61 | Support levels: $0.45, $0.40, $0.38
XRP/Dollar BitFinex 4-Hours Chart
XRP/Dollar BitFinex 1-Hour Chart
XRP-BTC Market
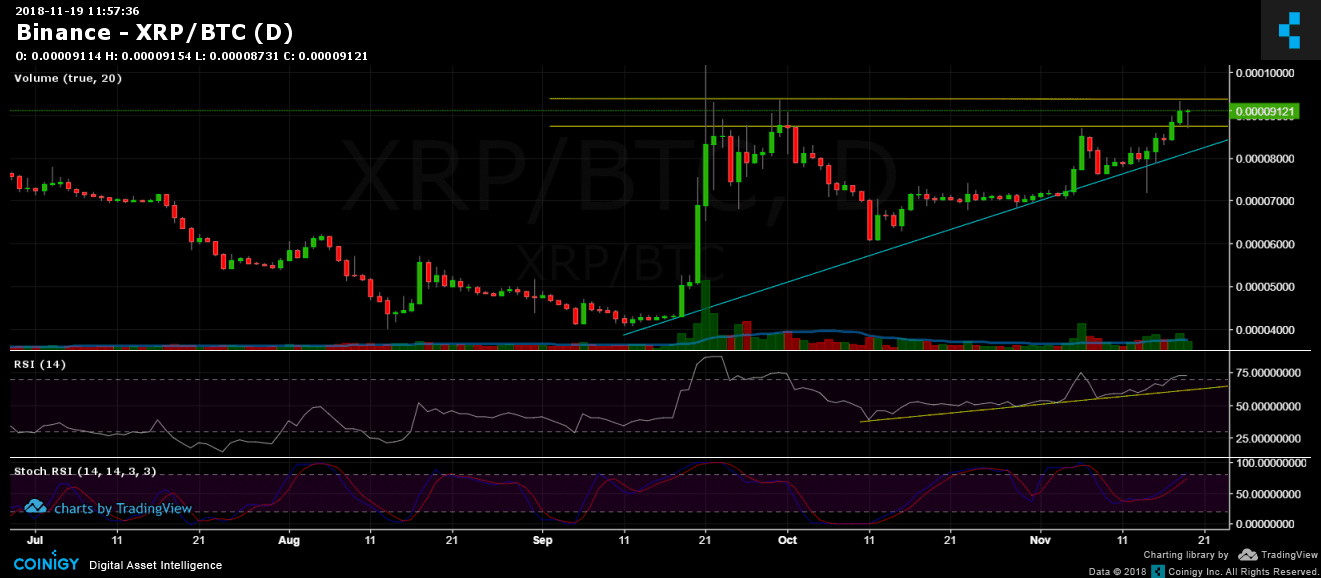
Against Bitcoin, the story is completely different. During this current bear market, Ripple seems to be the Gold to hedge Bitcoin.
Ripple looks bullish against BTC. In the following 1-day chart below, we can notice that Ripple had encountered a resistance yesterday (9400 Satoshi). The next significant support lies at 8760 Satoshi, along with the ascending trend-line (which supports the chart around 8300 Satoshi as of now).
RSI looks bullish in an ascending trend line, while Stochastic RSI is getting close to the overbought zone.
XRP/BTC Binance 1-Day Chart
Cryptocurrency charts by TradingView. Technical analysis tools by Coinigy.
The post Ripple XRP Price Analysis Nov.19: Ripple as a hedge against Bitcoin appeared first on CryptoPotato.