Ripple XRP Price Analysis Nov.16: Bearish despite the positive news?
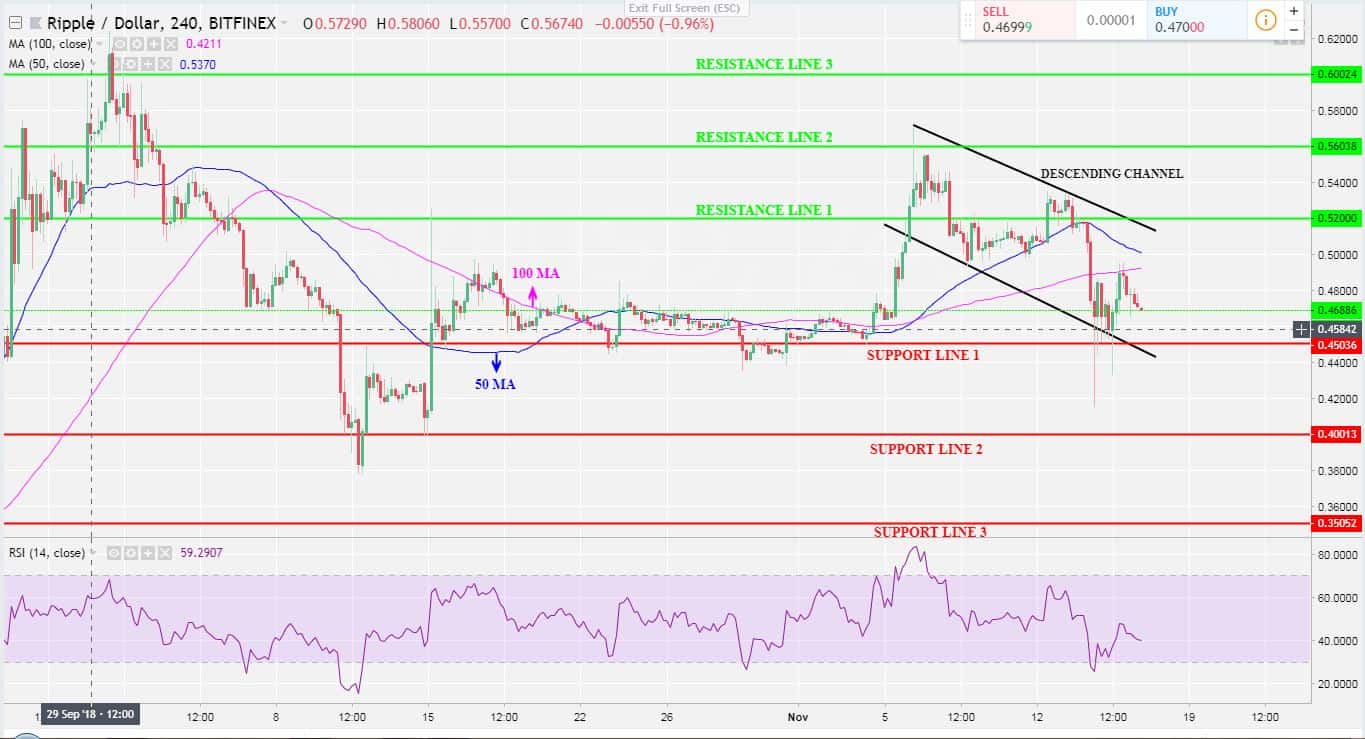
Ripple is trading in a descending channel between the low of $0.45 and the high of $0.55 price levels. As the selling pressure increases, the market continues in a down-trend
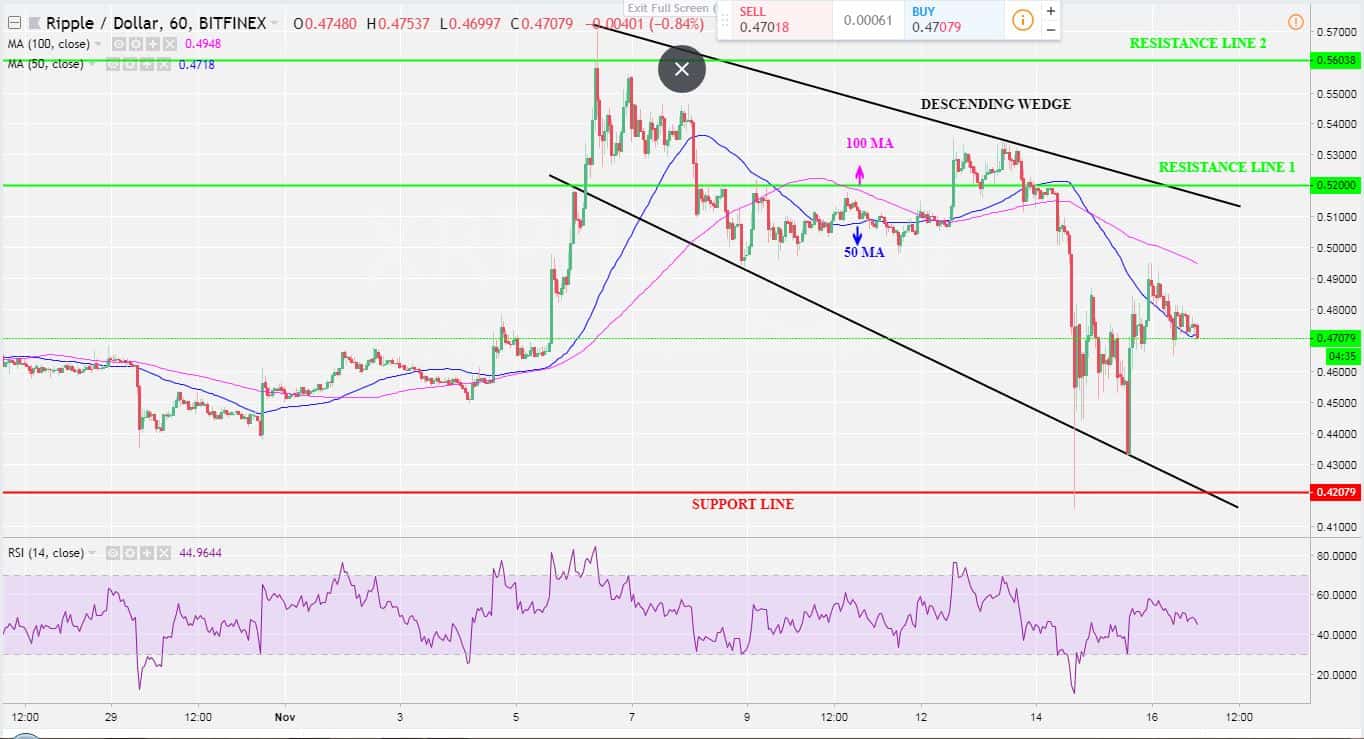
XRPUSD Short-term Trend: Bearish
As long as selling pressure is enormous, the XRP price will have difficulties. The appearance of the Short-term trend is directing in a falling wedge pattern is revealing the market to be bearish. The push and pull are maintaining and respecting the trendline.
The 50 and the 100 days moving average lines are pointing down: this is another sign that this pair is trending low below the 100 MA and using the 50 MA as a support level. However, there is a high chance to re-test $0.42 support level before making a bullish pullback.
XRPUSD Medium-term Trend: Bearish
With a simple look at the four-hour chart, it is observed that the trend and pattern of this pair are in a descending channel which is a confirmation of a bearish market. Over time, the candlesticks have been obeying the channel showing a fall in the XRPUSD price.
XRP has been experiencing a down-trend movement for over eight. This is due to the high supply force of the sellers as they hold price lower to maintain the trend in a pull. As it appears on the Medium-term outlook, the bears will be losing momentum as soon as price reaches $0.45 support level. The bulls will be on a watch for smart entry as they push price higher to $0.52 resistance level, where the top of the descending channel lies.
The Relative Strength Index (RSI) Period 14 is at its low levels (40), and might signals that the market is oversold.
Key Levels
Resistance levels: $0.52, $0.56, $0.60
Support levels: $0.45, $0.42, $0.40, $0.35
XRP/Dollar BitFinex 4-Hours Chart

XRP/Dollar BitFinex 1-Hour Chart
 Cryptocurrency charts by TradingView.
The post Ripple XRP Price Analysis Nov.16: Bearish despite the positive news? appeared first on CryptoPotato.


