Ripple XRP Price Analysis Jan.8: The $0.4 Resistance is Getting Closer
The crypto market is still showing strength and might be retesting the highs.
Bitcoin price breached above the symmetrical triangle formation two days ago with green candles and a flag formation evolved since then in the 1-4 hours chart. The upper flag’s trend line was breached today, a move that ignited the other big Altcoins.
XRP hasn’t reacted to that move yet, but the chart is in a very interesting scenario.
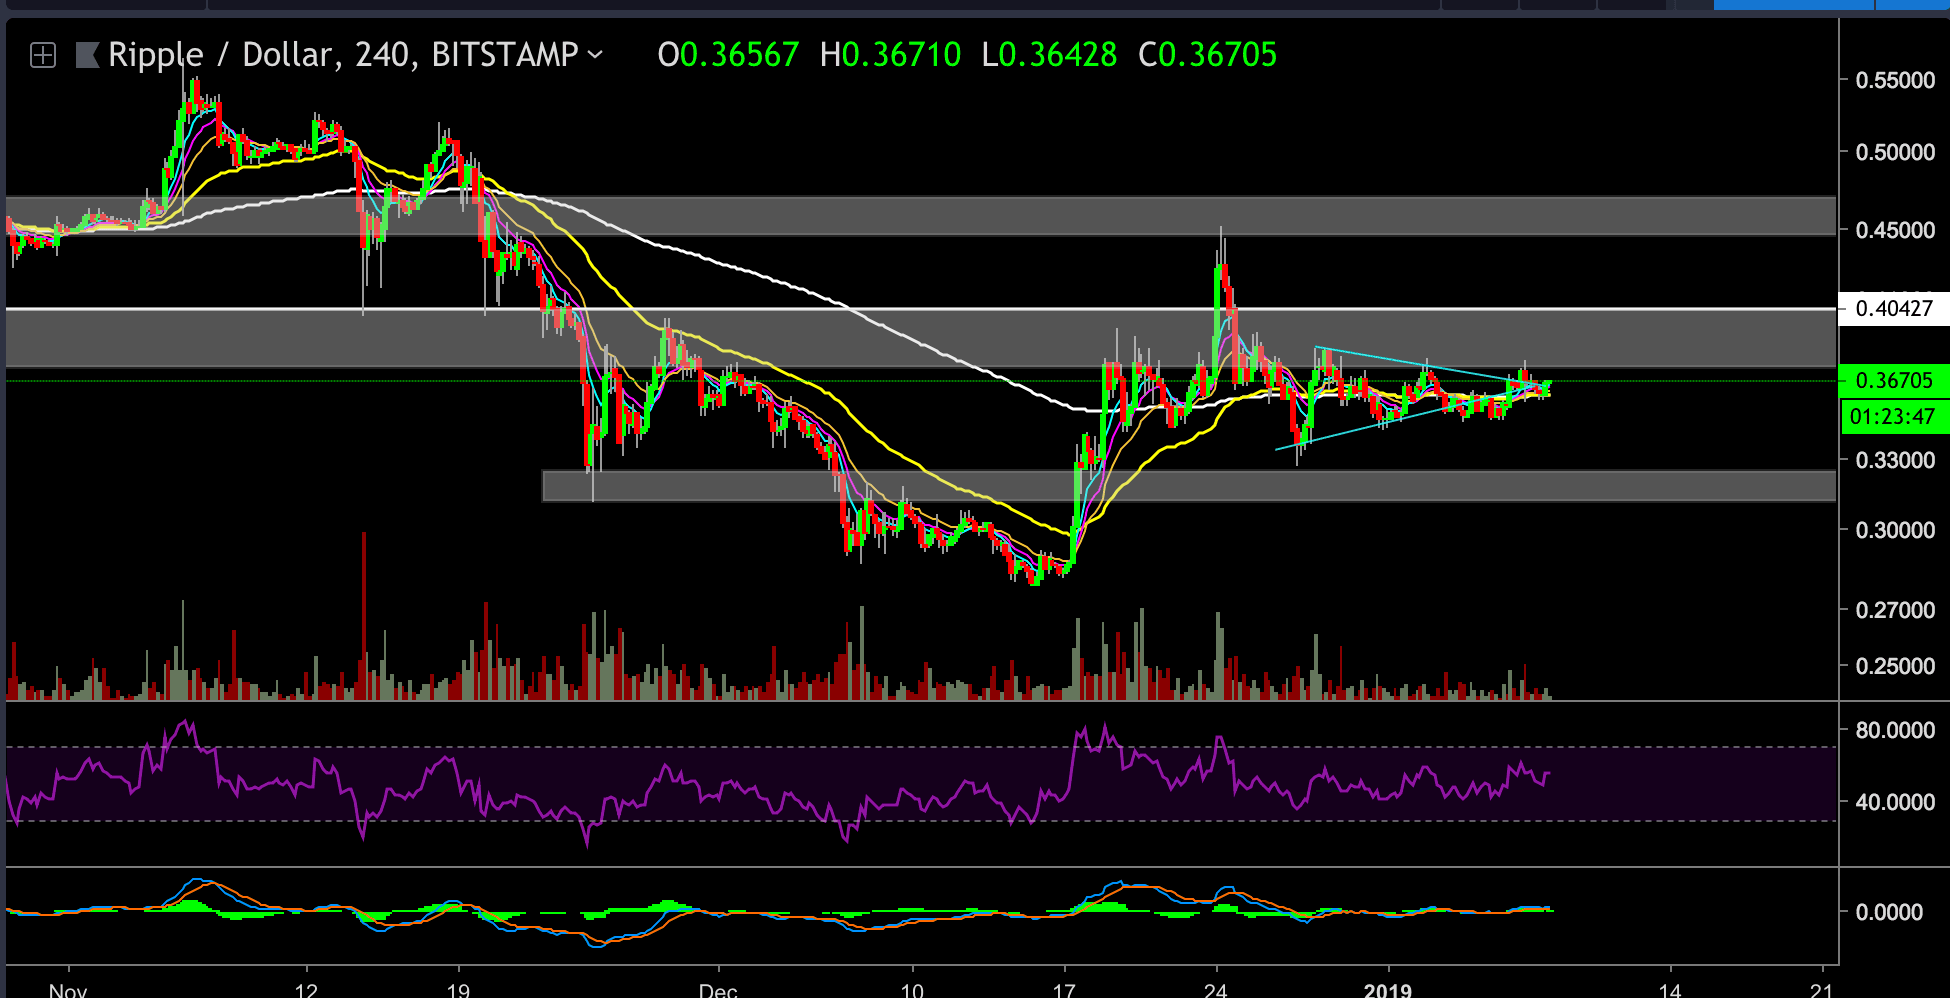
XRP is currently trading at the $0.37 price level, and it’s at the APEX of the symmetrical triangle formation (apex is the tip of the triangle where the two contracting lines meet).
Looking at the 4-Hours Chart
- XRP is at the Apex of the triangle at the time of writing this post, support by all the EMA’s that we use on our charts (8,13,22,55,200) it is a very positive set up.
- Four hours chart RSI is creating higher lows, but it is currently in the mid part of the channel. For the moment there is no clear signal for an immediate move, but it does look a bit more bullish than bearish.
- If BTC continues the upward move, then XRP is likely to follow as well.
- As mentioned in the previous posts, the $0.4 price level is a significant one for XRP as it is a historical price level. XRP first rally that ended on May 2017 finished at this exact price level.
- The $0.4 resistance level is acting as the first target.
- There is a hope to see the mentioned resistance level broken and hopefully, XRP will retest it as a support level, this scenario could be a very nice set up for a trade, but it is important to remember that the BTC price is controlling the market so always check the BTC chart immediate scenario before jumping into trades.
- On the other hand, a different scenario could be a break of the symmetrical triangle formation to the downside, or even a break to the upside that closes as a shooting star candle (a bullish trap), if that case XRP could decline to $0.35 or lower to the previous support level of $0.324-$0.31.
BitStamp XRP/USD 4-Hour Chart
BitStamp XRP/USD 1-Day Chart
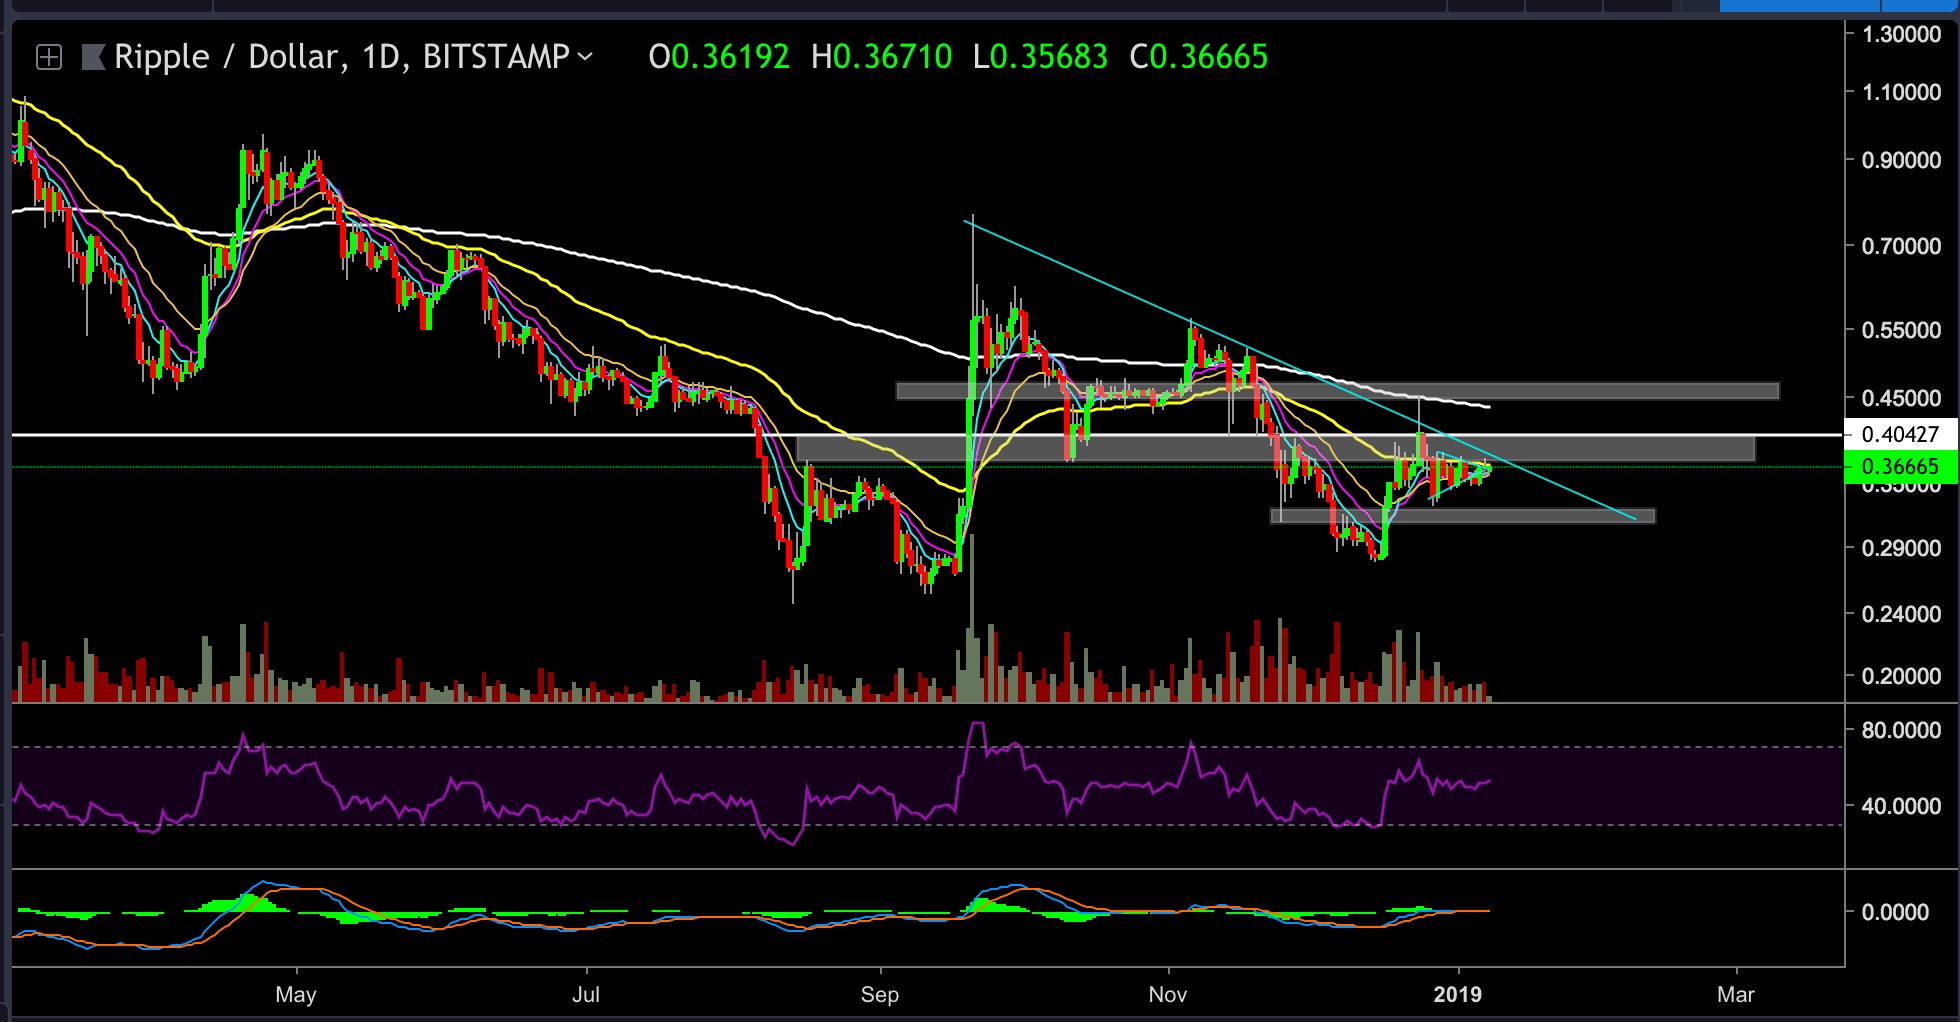
Notice the upper blue declining trend line. This trend line could interfere and act as another resistance forth if XRP chart chooses the Bulls side.
The post Ripple XRP Price Analysis Jan.8: The $0.4 Resistance is Getting Closer appeared first on CryptoPotato.