Ripple (XRP) Price Analysis Feb.20: Following The Sentiment, Ripple Broke Up The Symmetrical Triangle
Following the bullish sentiment in the crypto markets, Ripple has broken above the $0.34 level, for the second time over the past 24 hours of trading. The cryptocurrency has now seen an impressive 8.5% weekly price spike.
It’s likely to say that Ripple has the largest inverse correlation to Bitcoin. Hence, the last bull-run of Bitcoin did cause XRP-USD to raise. However, XRP-BTC hadn’t changed much.
Ripple is still ranked on the third position of the largest cryptos by market cap as it currently holds a $13.7 billion market cap.
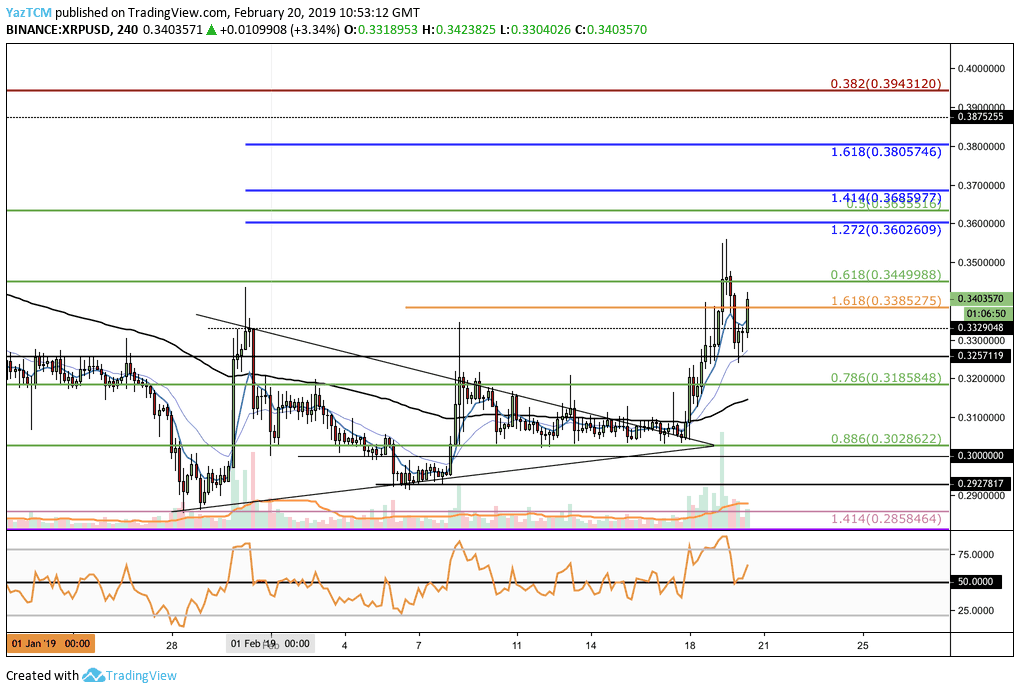
Looking At The BTC/USD 1-Day Chart:
- Ripple has broken above the symmetrical triangle outlined in our previous XRP analysis.
- Following the breakout, the market continued to surge higher into resistance at the short-term .618 Fibonacci Retracement level at $0.3449 (marked in green), then, the market fell slightly but quickly recovered as it currently trades at the $0.33 area.
- From above: The nearest resistance lies at the $0.3449 If the buyers can break above this, we can expect higher resistance to get retested for the short term .5 Fibonacci Retracement level lies at $0.3655 (marked in green).
- Further resistance lies at the short term 1.414 ($0.3685) and 1.618 ($0.3805) Fibonacci Extension levels (marked in blue).
- Significant resistance above $0.38 lies at the bearish .382 Fibonacci Retracement level around $0.3943 (marked in red).
- From below: The nearest support lies at $0.33 and $0.3257. If the sellers continue further lower, the short term .886 Fibonacci Retracement level lies at $0.3028 (marked in green and below is the $0.30 level.
- The RSI has rebounded from the 50 zone which indicates that the bulls are still in control of the market.
- The trading volume has steadily been increasing over the past days.
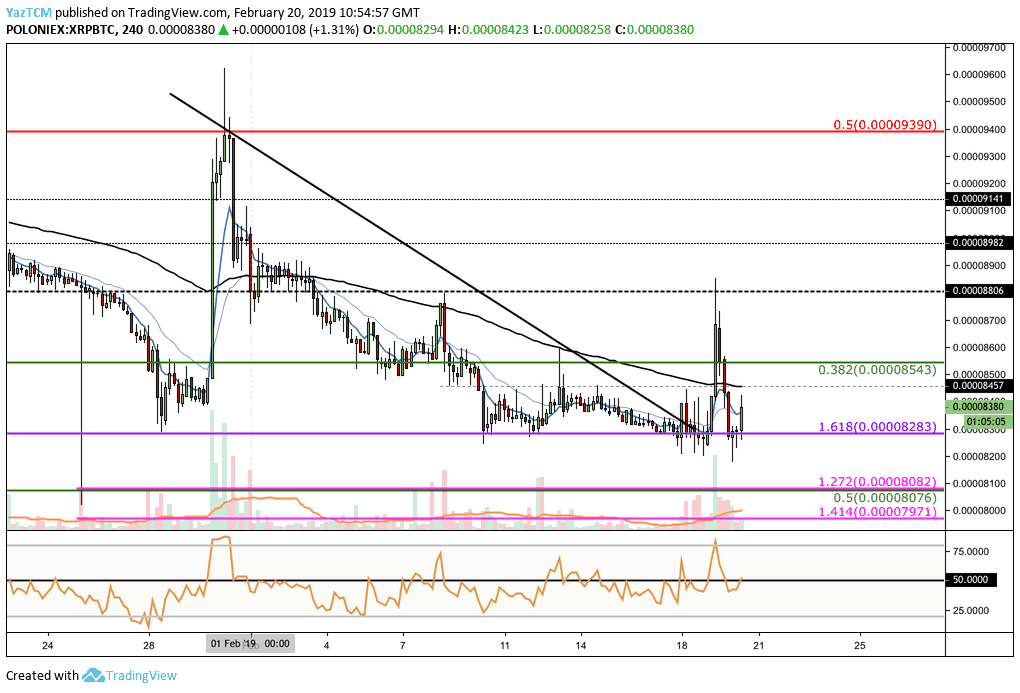
Looking At The XRP/BTC 1-Day Chart:
- XRP/BTC has also broken above the descending wedge formation. However, after reaching resistance at 8806 SAT the market fell sharply and found support at 8283 SAT.
- From above: The nearest resistance is expected at 8543 SAT followed by 8806 SAT.
- Further resistance lies at 8982 SAT and 9141 SAT levels and the bearish .5 Fibonacci Retracement level at 9390 SAT (marked in red).
- From below: The nearest significant support lies at the long-term downside 1.618 Fibonacci Extension level lies at 8283 SAT (marked in purple).
- Beneath, support lies at the short term .5 Fibonacci Retracement level lies at 8076 SAT (marked in green) and at the short-term downside 1.272 Fibonacci Extension situated in the same area.
- The RSI is about to penetrate above the 50 levels as the Bulls battle for control.
- The volume has also been increasing in this market over the past few days.
The post Ripple (XRP) Price Analysis Feb.20: Following The Sentiment, Ripple Broke Up The Symmetrical Triangle appeared first on CryptoPotato.