Ripple Seems Primed for a Drop to $0.5, But Will the Bulls Retaliate? (XRP Price Analysis)
Ripple’s price has been consolidating against USDT while consistently dropping lower against BTC. Things might get even worse in the short term if nothing changes from a technical analysis aspect.
Technical Analysis
By TradingRage
The USDT Paired Chart
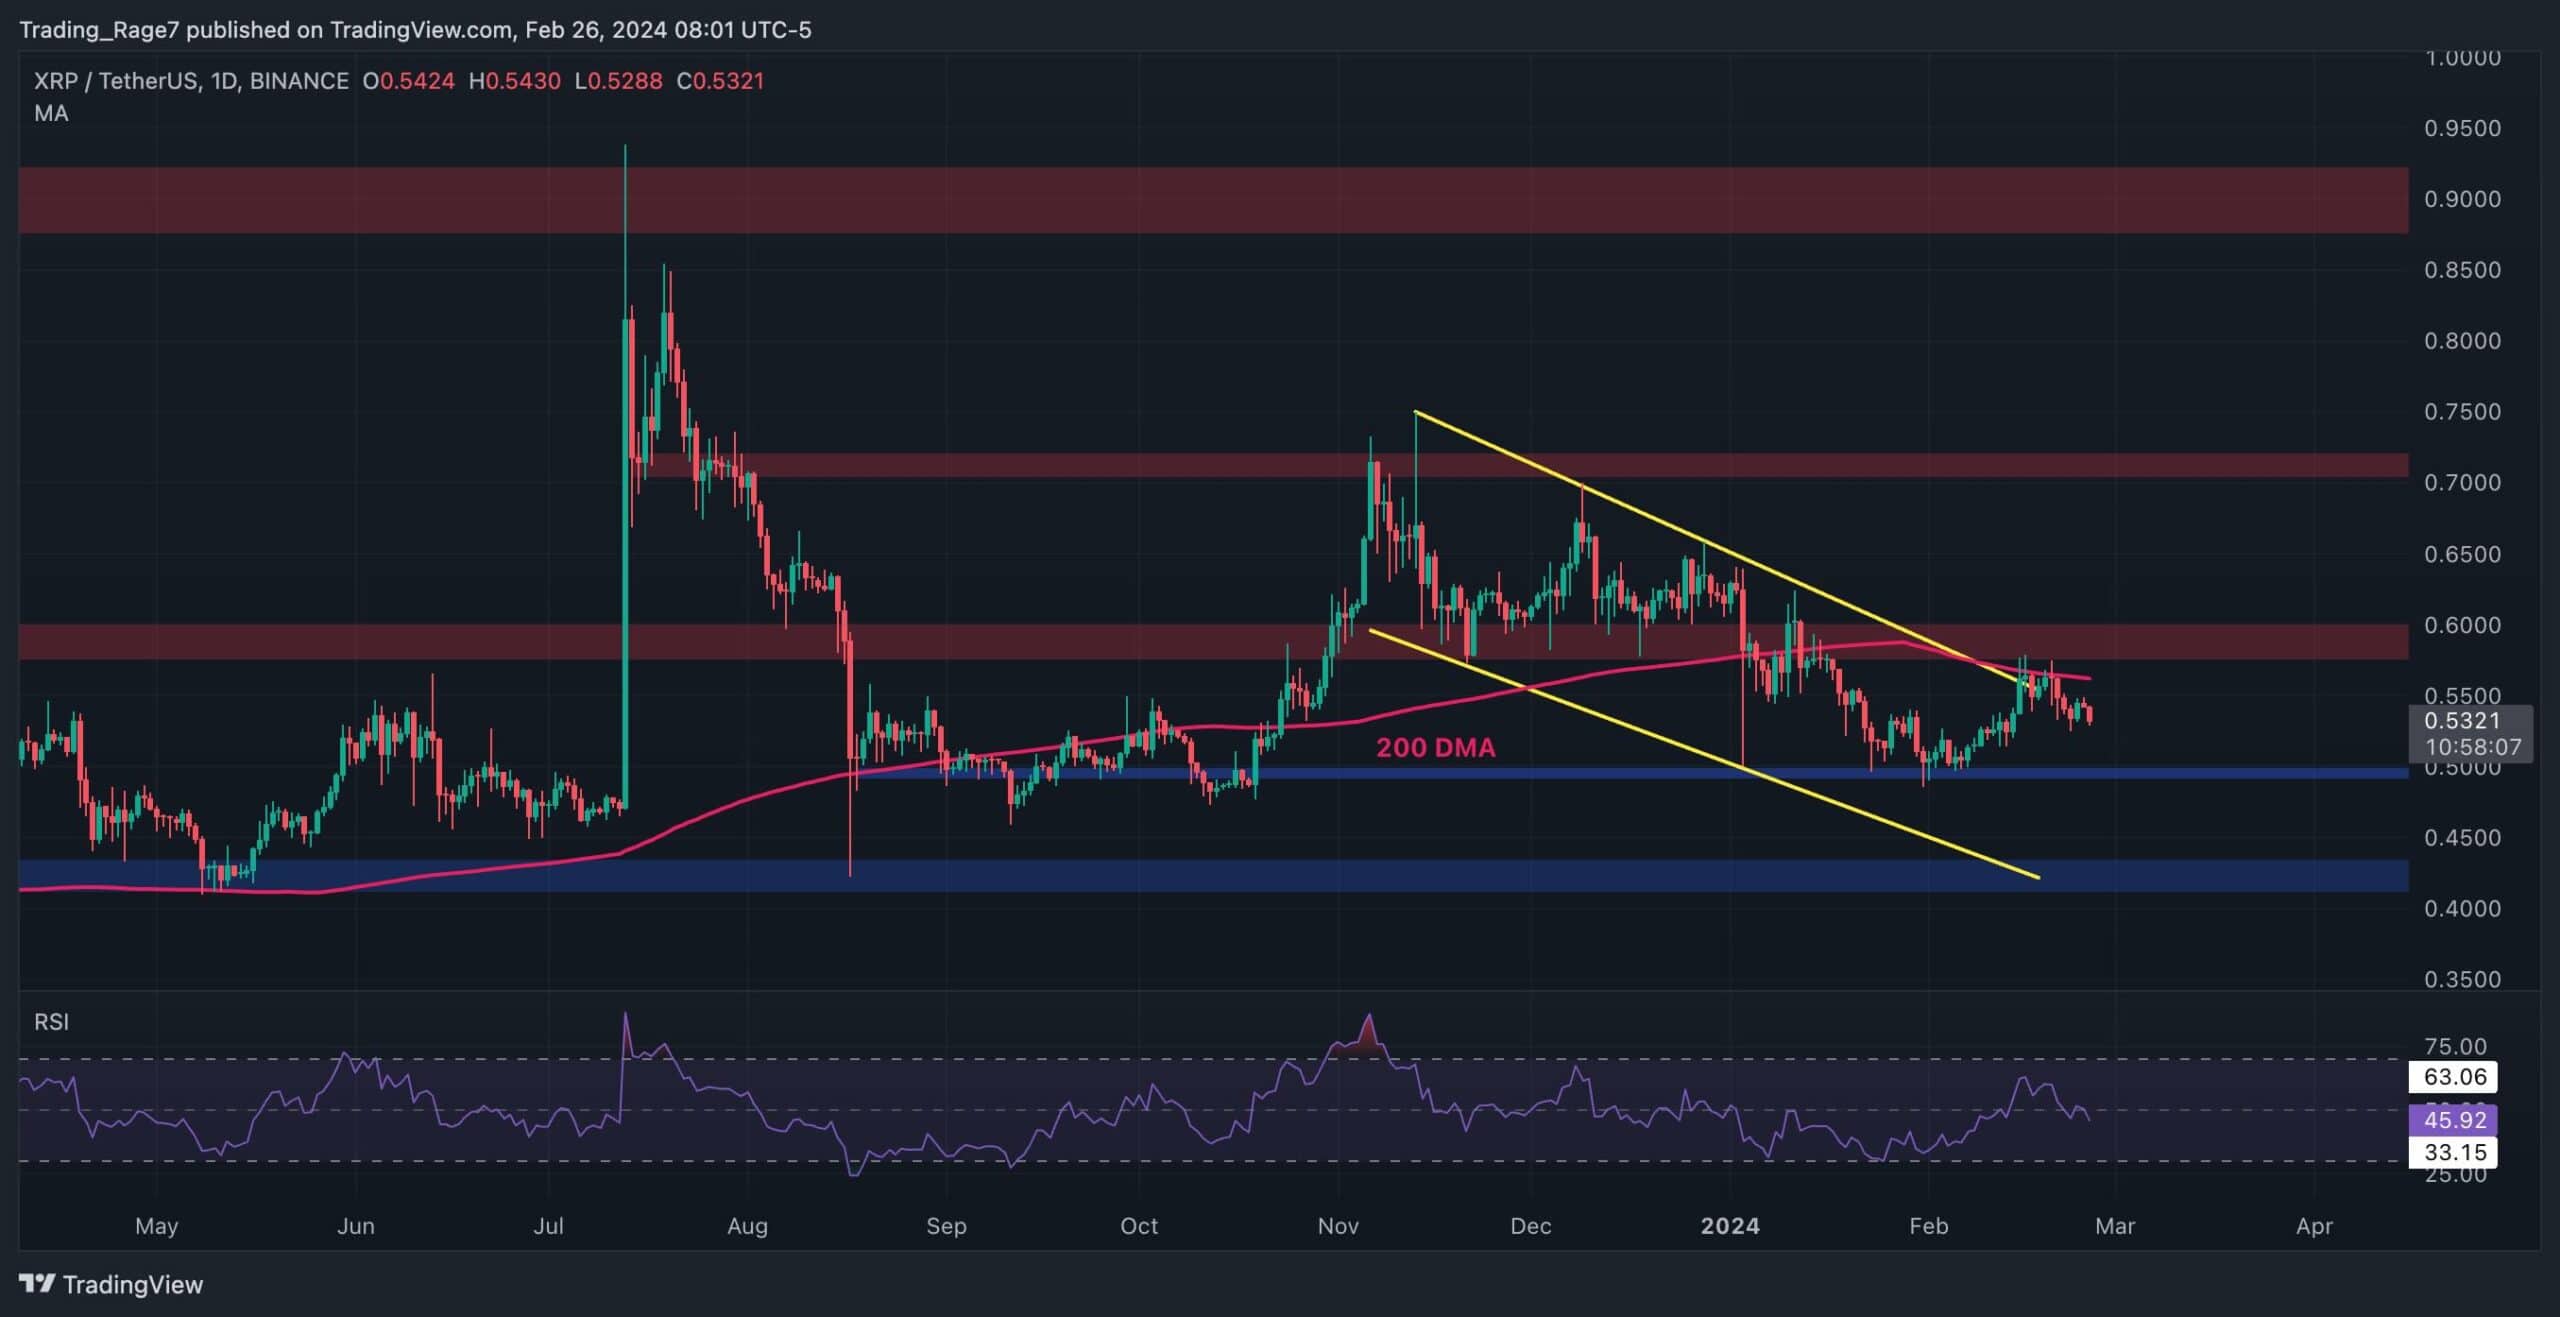
On the daily chart, the price has been testing the higher boundary of the large descending channel and the 200-day moving average around the $0.55 price mark.
However, the 200-day moving average has rejected the price to the downside, and the market is likely to pull back toward the $0.50 level in the short term. The RSI breaking below the 50% level is also another signal that such correction is probable.
The BTC Paired Chart
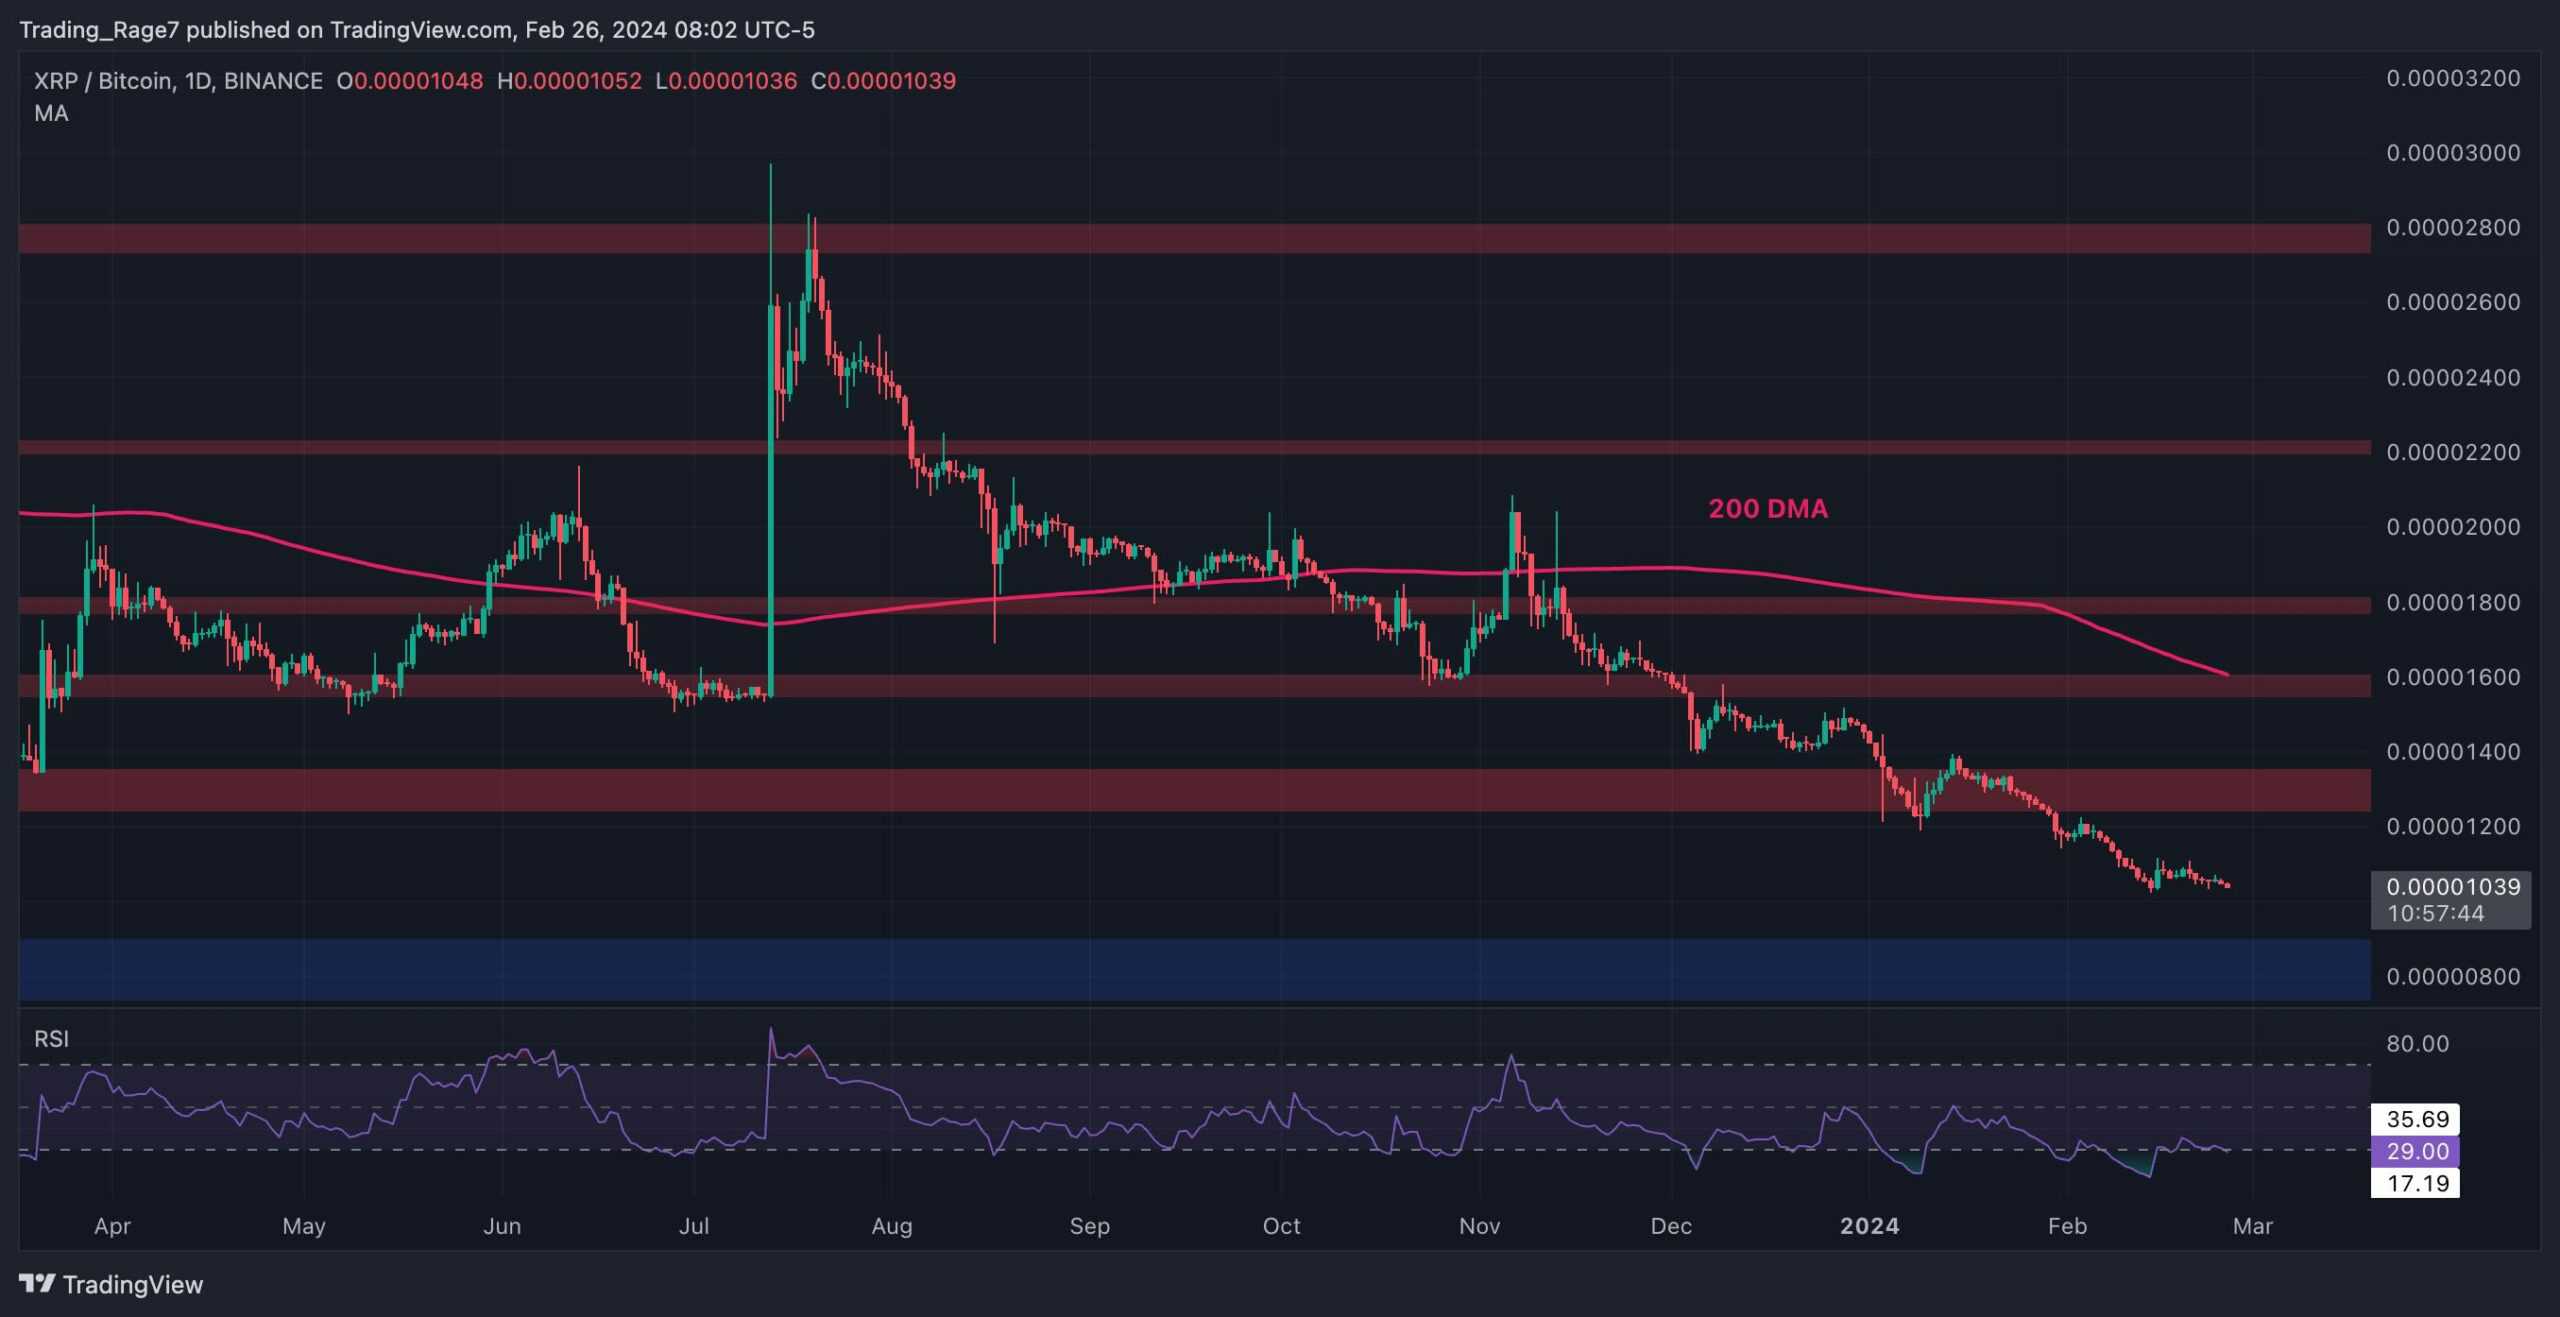
Looking at the Bitcoin pair’s daily timeframe, things are looking much worse for Ripple. The price has been on a consistent downtrend since breaking below the 1300 SAT level.
The RSI has also been showing values below 50% for a while now, indicating that the cryptocurrency is likely to drop even lower in the upcoming months. The 800 SAT support level can be a feasible target in this scenario before the market finds a bottom.
The post Ripple Seems Primed for a Drop to $0.5, But Will the Bulls Retaliate? (XRP Price Analysis) appeared first on CryptoPotato.