Ripple Recorded Today Its Lowest Price Since 2017: Can XRP Recover From Here? Analysis & Overview
XRP saw a steep price decline of around 5.15% over the past 24 hours and it currently trades at $0.22. During the day, the cryptocurrency dropped to as low as $0.19 creating a fresh low that hasn’t been seen for almost 2 years.
Despite this, there are still some positive developments within the Ripple ecosystem. For example, Mercury FX, a global currency exchange provider, has recently announced its plans to expand the use of On-Demand Liquidity (formerly xRapid) – an XRP-based payment solution provided by Ripple.
XRP remains the third-largest cryptocurrency with a market cap of $9.52 billion.
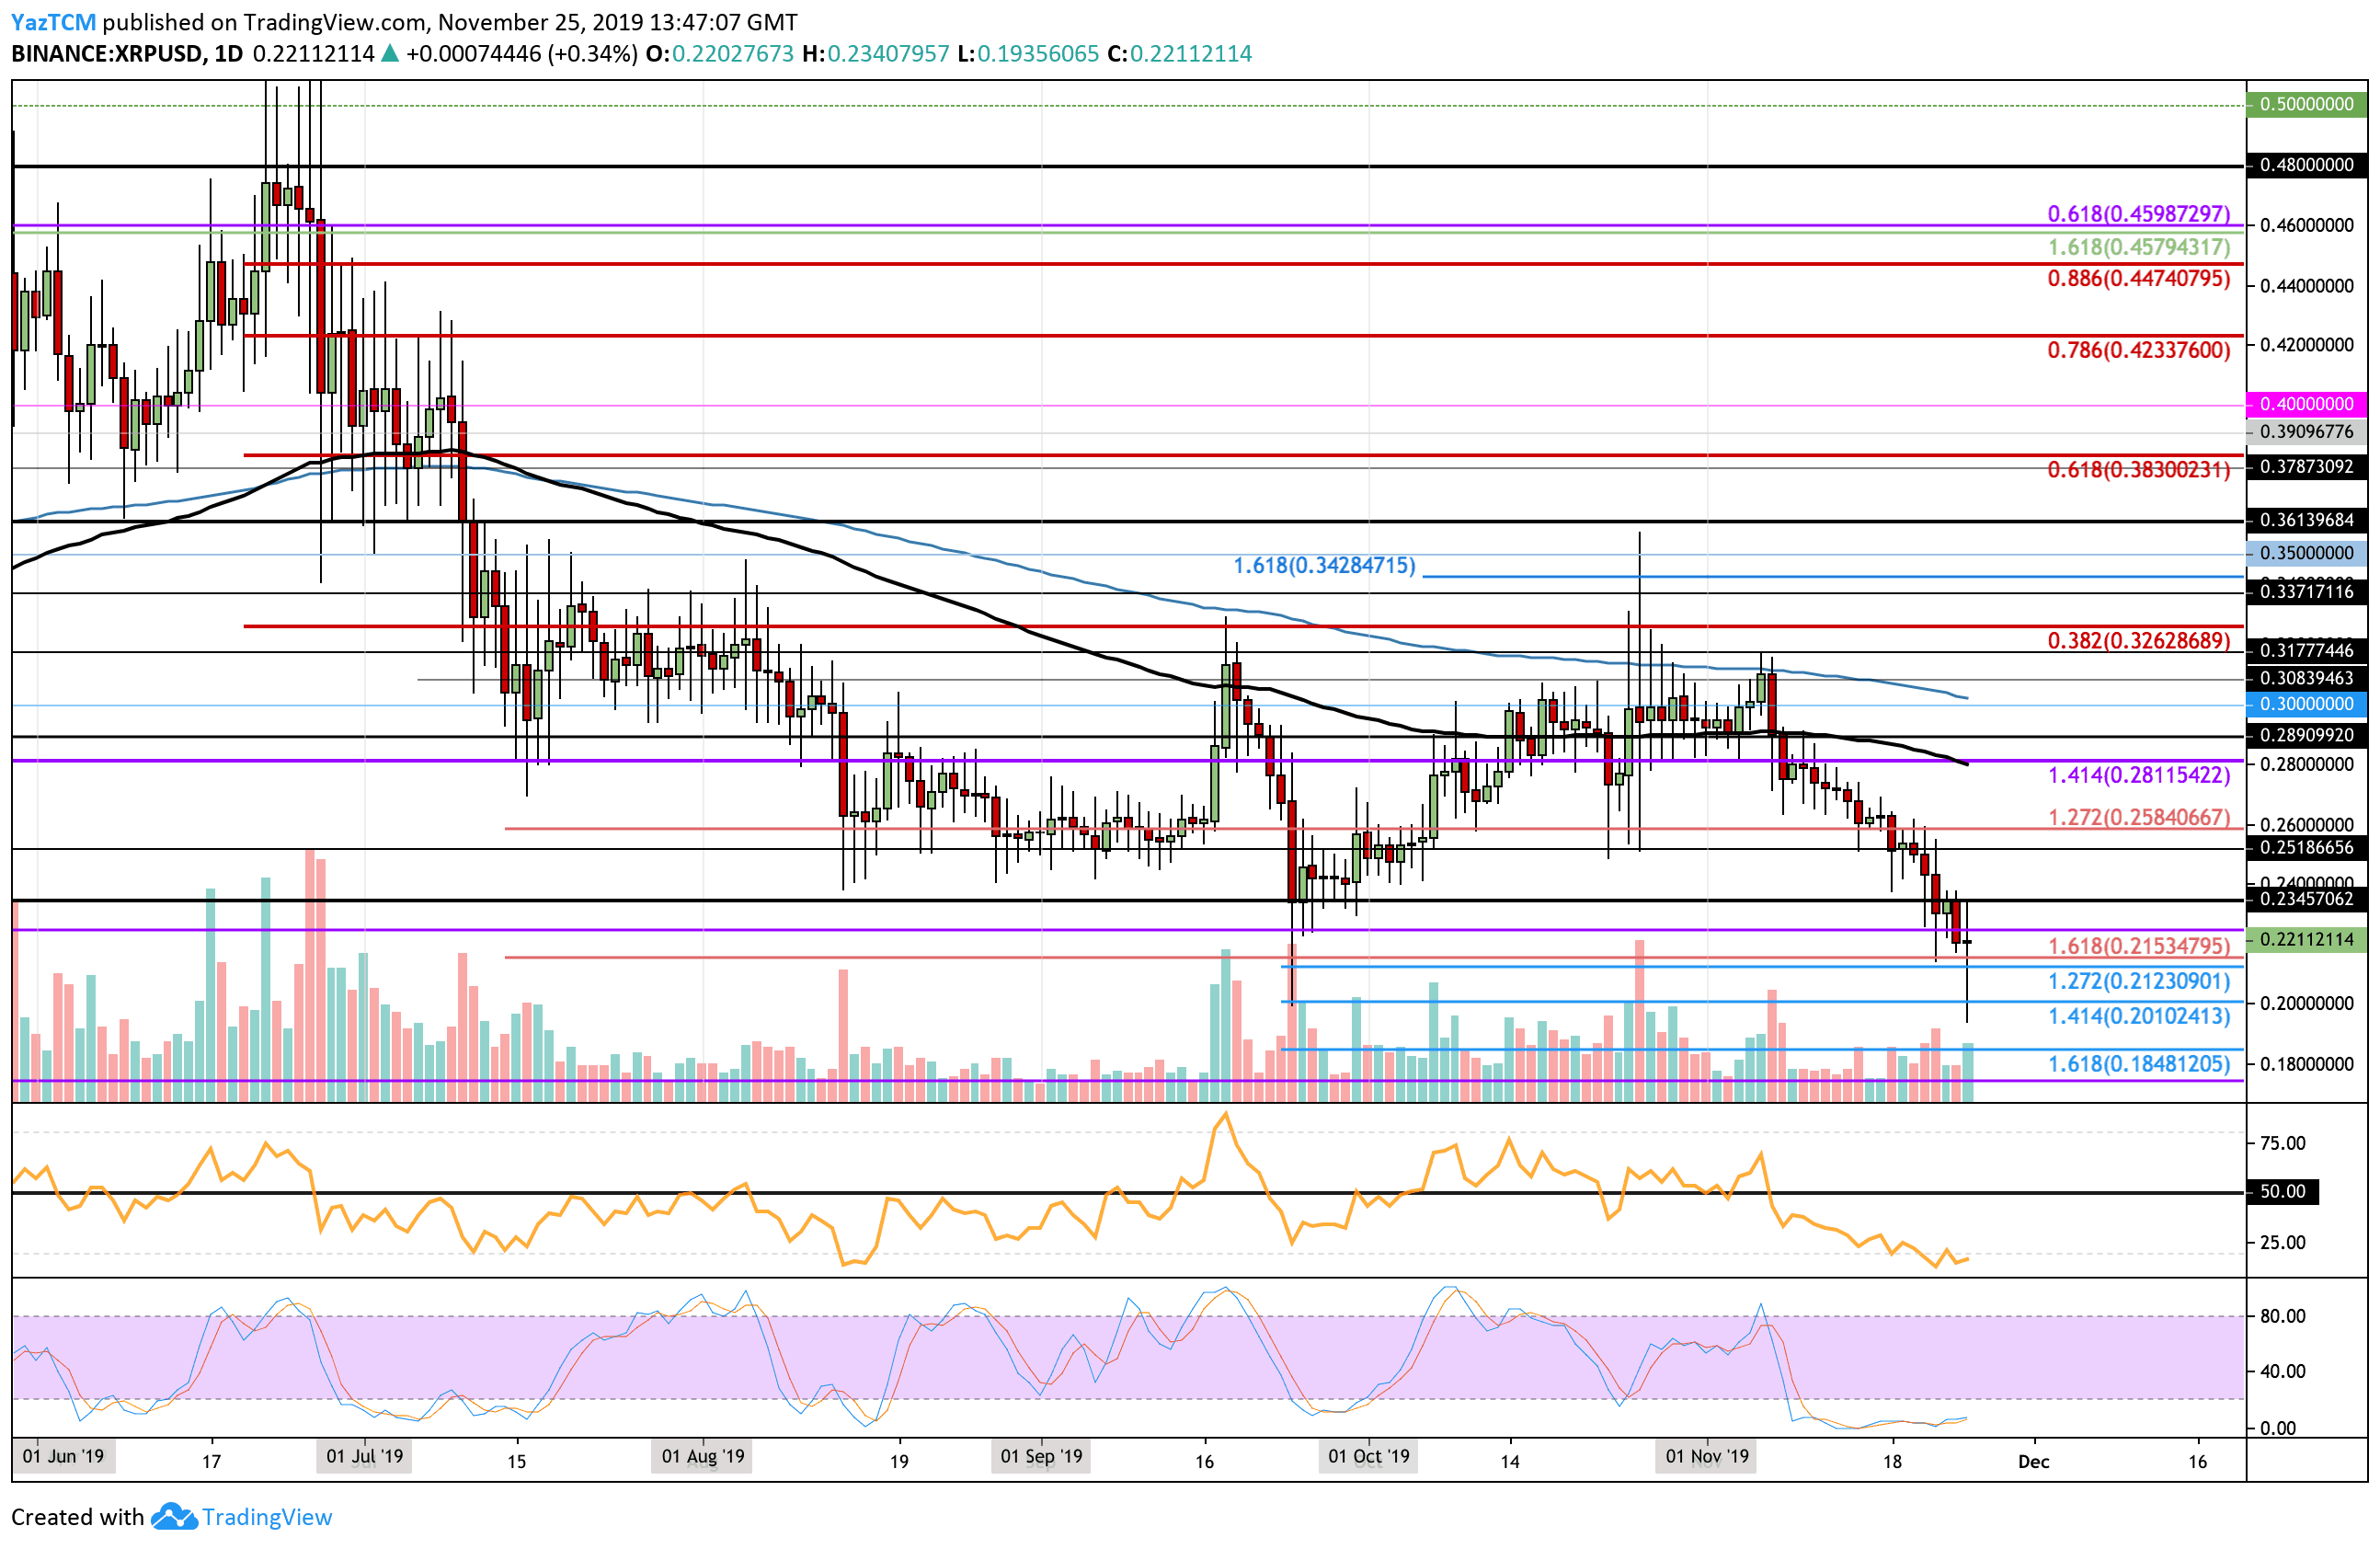
Looking at the XRP/USD 1-Day Chart:
- Since our last analysis, XRP continued to go lower but found support around $0.215. XRP did drop much lower into the $0.19 level but managed to rebound swiftly.
- From above: The nearest level of resistance lies at $0.234. Above this, resistance is found at $0.252, $0.260, and $0.2811 (100-days EMA).
- From below: The nearest level of support lies directly at $0.215. Beneath this, support is located at $0.2010 (downside 1.414 Fib Extension), and $0.1850 (downside 1.618 Fibonacci Extension level).
- The trading volume remains quite high but still beneath the average level for October 2019.
- The RSI has recently reached extreme oversold conditions which shows a very bearish market for XRP. For signs of a recovery, we will look for the RSI to rise toward 50 to show that the bearish pressure is diminishing. Furthermore, the Stochastic RSI has been in oversold conditions for the entire period of November and is primed for a bullish crossover signal which should send the market higher.
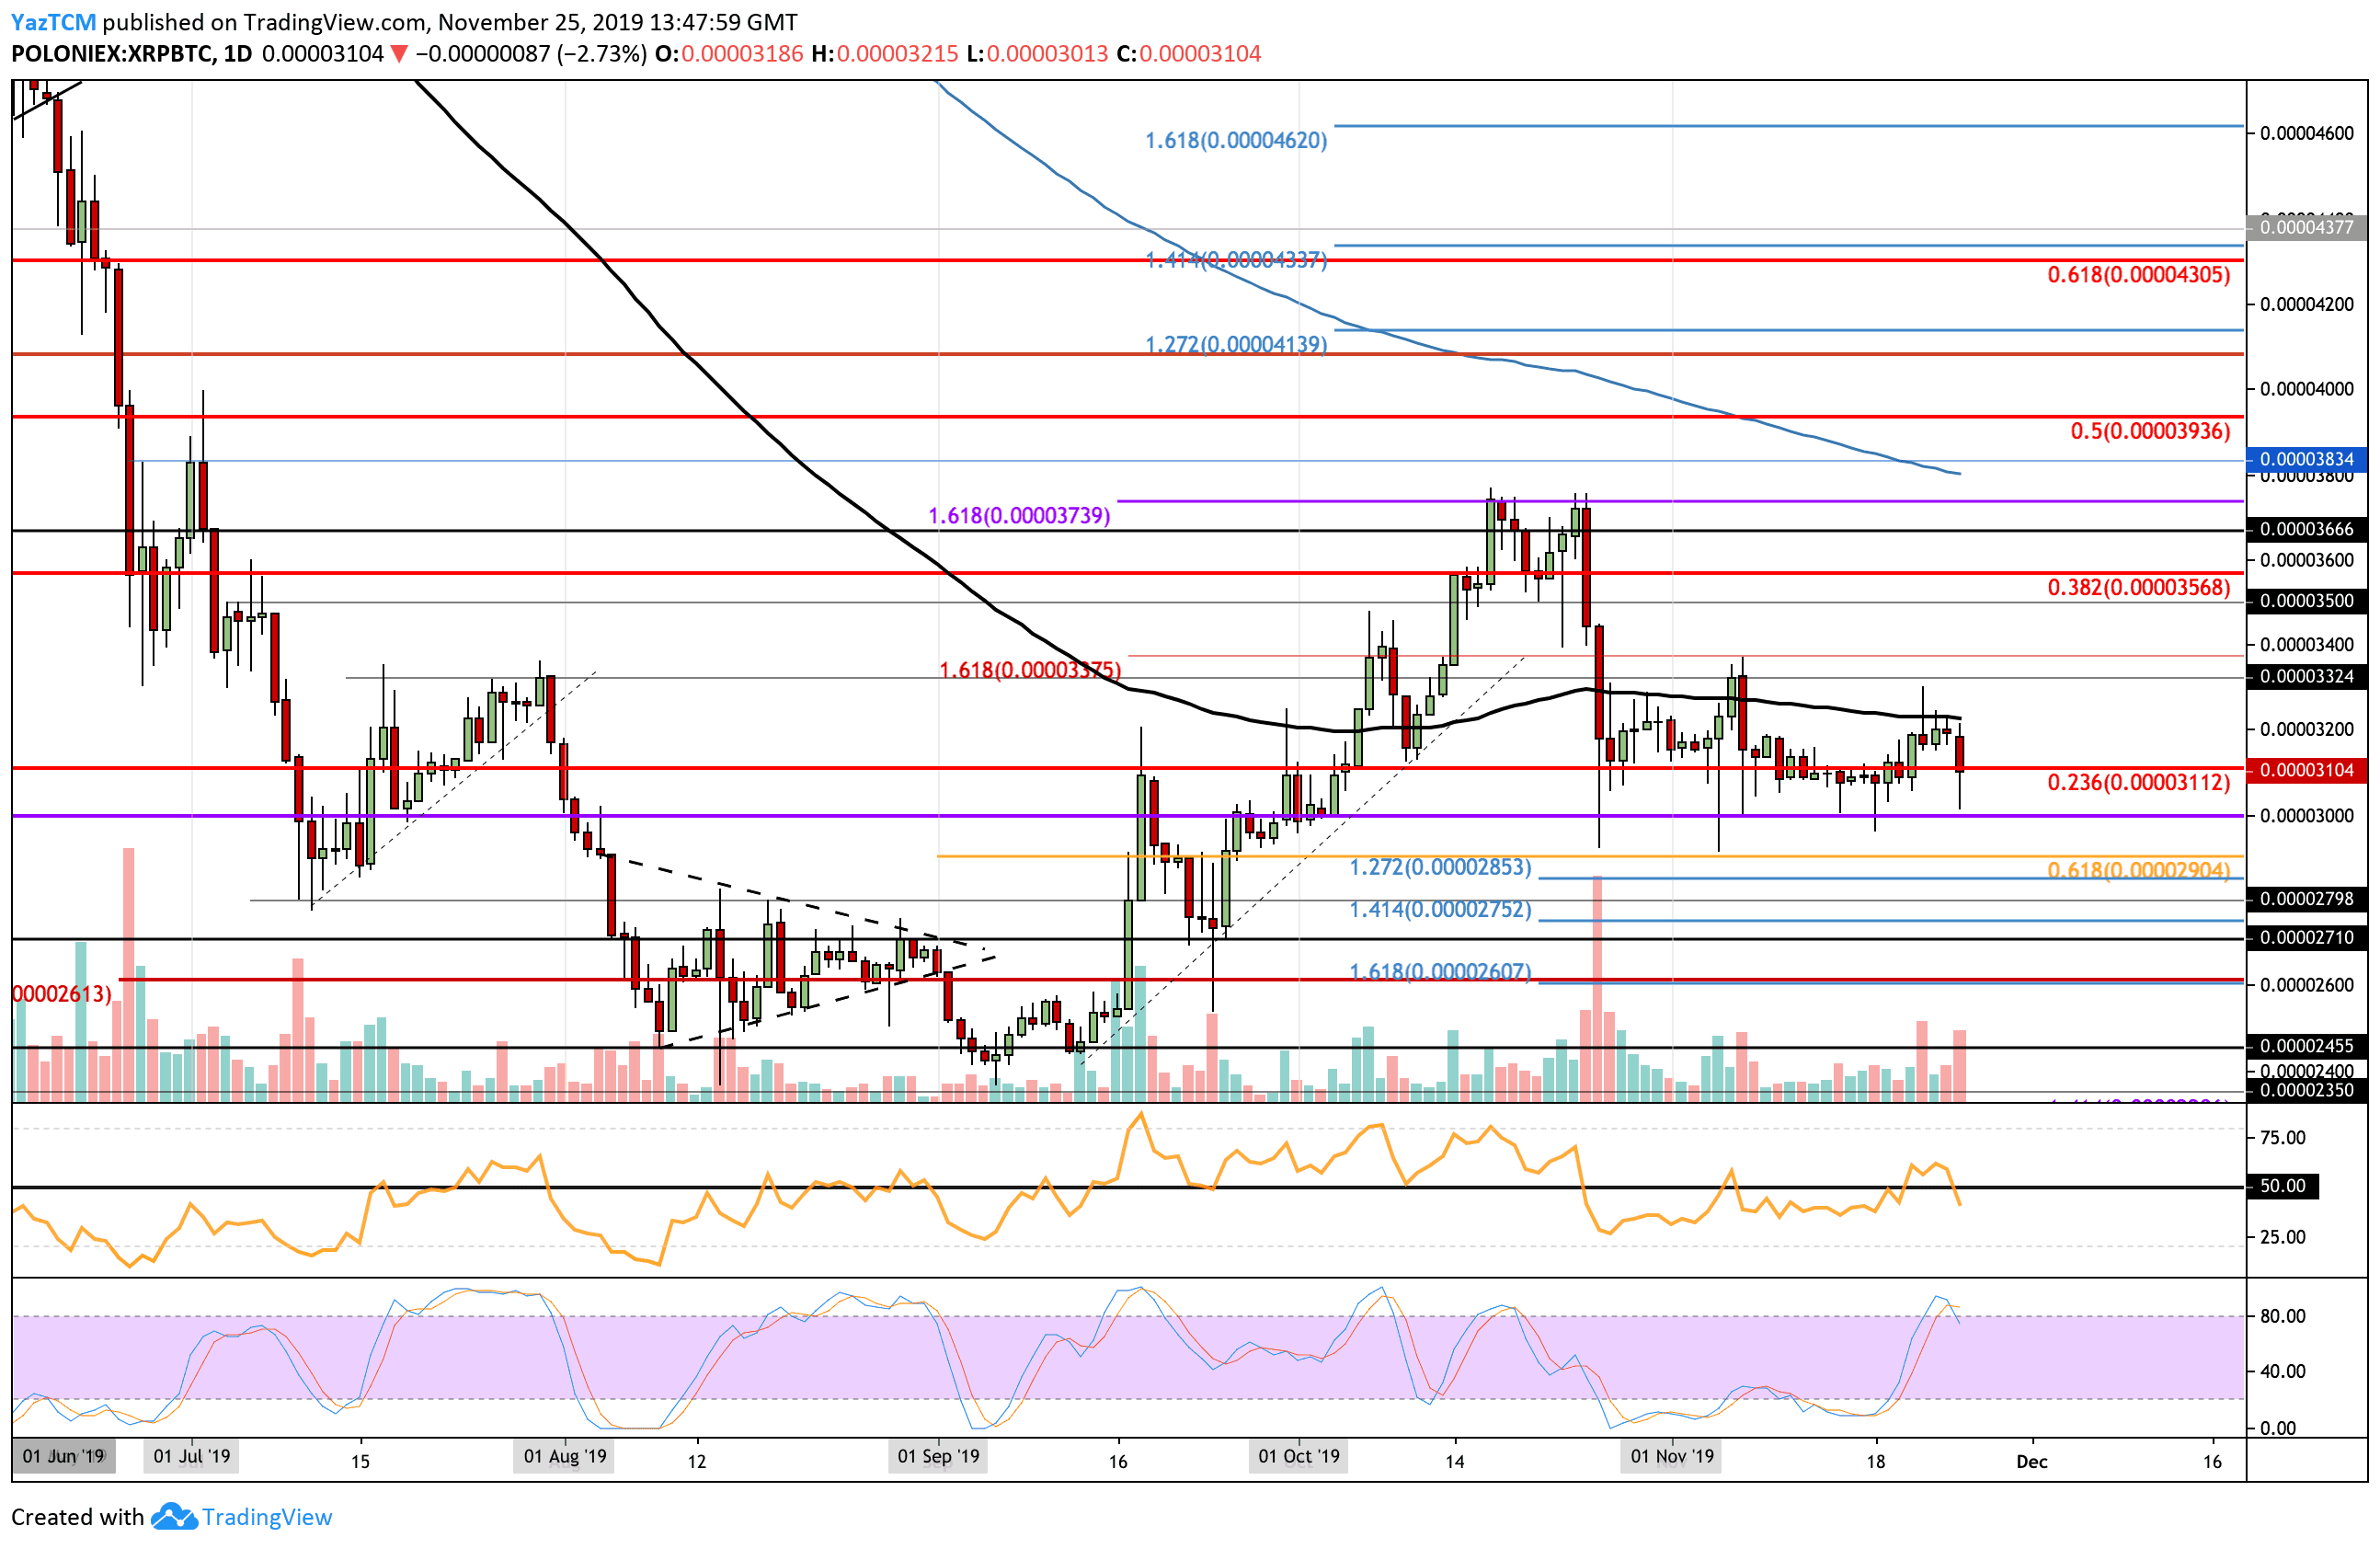
Looking at the XRP/BTC 1-Day Chart:
- Against Bitcoin, XRP attempted to go higher but was trapped by resistance at the 100-days EMA. After reaching this level, XRP fell lower back into the support at 3112 SAT.
- From above; The nearest level of resistance lies at 3200 SAT (100-days EMA). Above this, resistance is located at 3375 SAT, 3500 SAT, 3570 SAT SAT, and 3740 SAT.
- From below: The nearest level of support lies at 3000 SAT. Beneath this, support lies at 2900 SAT (short term .618 Fib Retracement), 2800 SAT, 2750 SAT (downside 1.414 Fib Extension), and 2600 SAT (downside 1.618 Fib Extension).
- The trading volume has been increasing during the latest round of selling.
- The RSI has recently dipped back beneath the 50 level as the bears begin to take control over the market momentum. Furthermore, the Stochastic RSI is poised for a bearish crossover signal which will send the market lower.
The post Ripple Recorded Today Its Lowest Price Since 2017: Can XRP Recover From Here? Analysis & Overview appeared first on CryptoPotato.

