Ripple Price Analysis: XRP Up 30% Weekly, Facing Huge Resistance at $1
XRP/USD – XRP Slips Back Below $1
Key Support Levels: $0.932, $0.88, $0.8282.
Key Resistance Levels: $1, $1.10, $1.21.
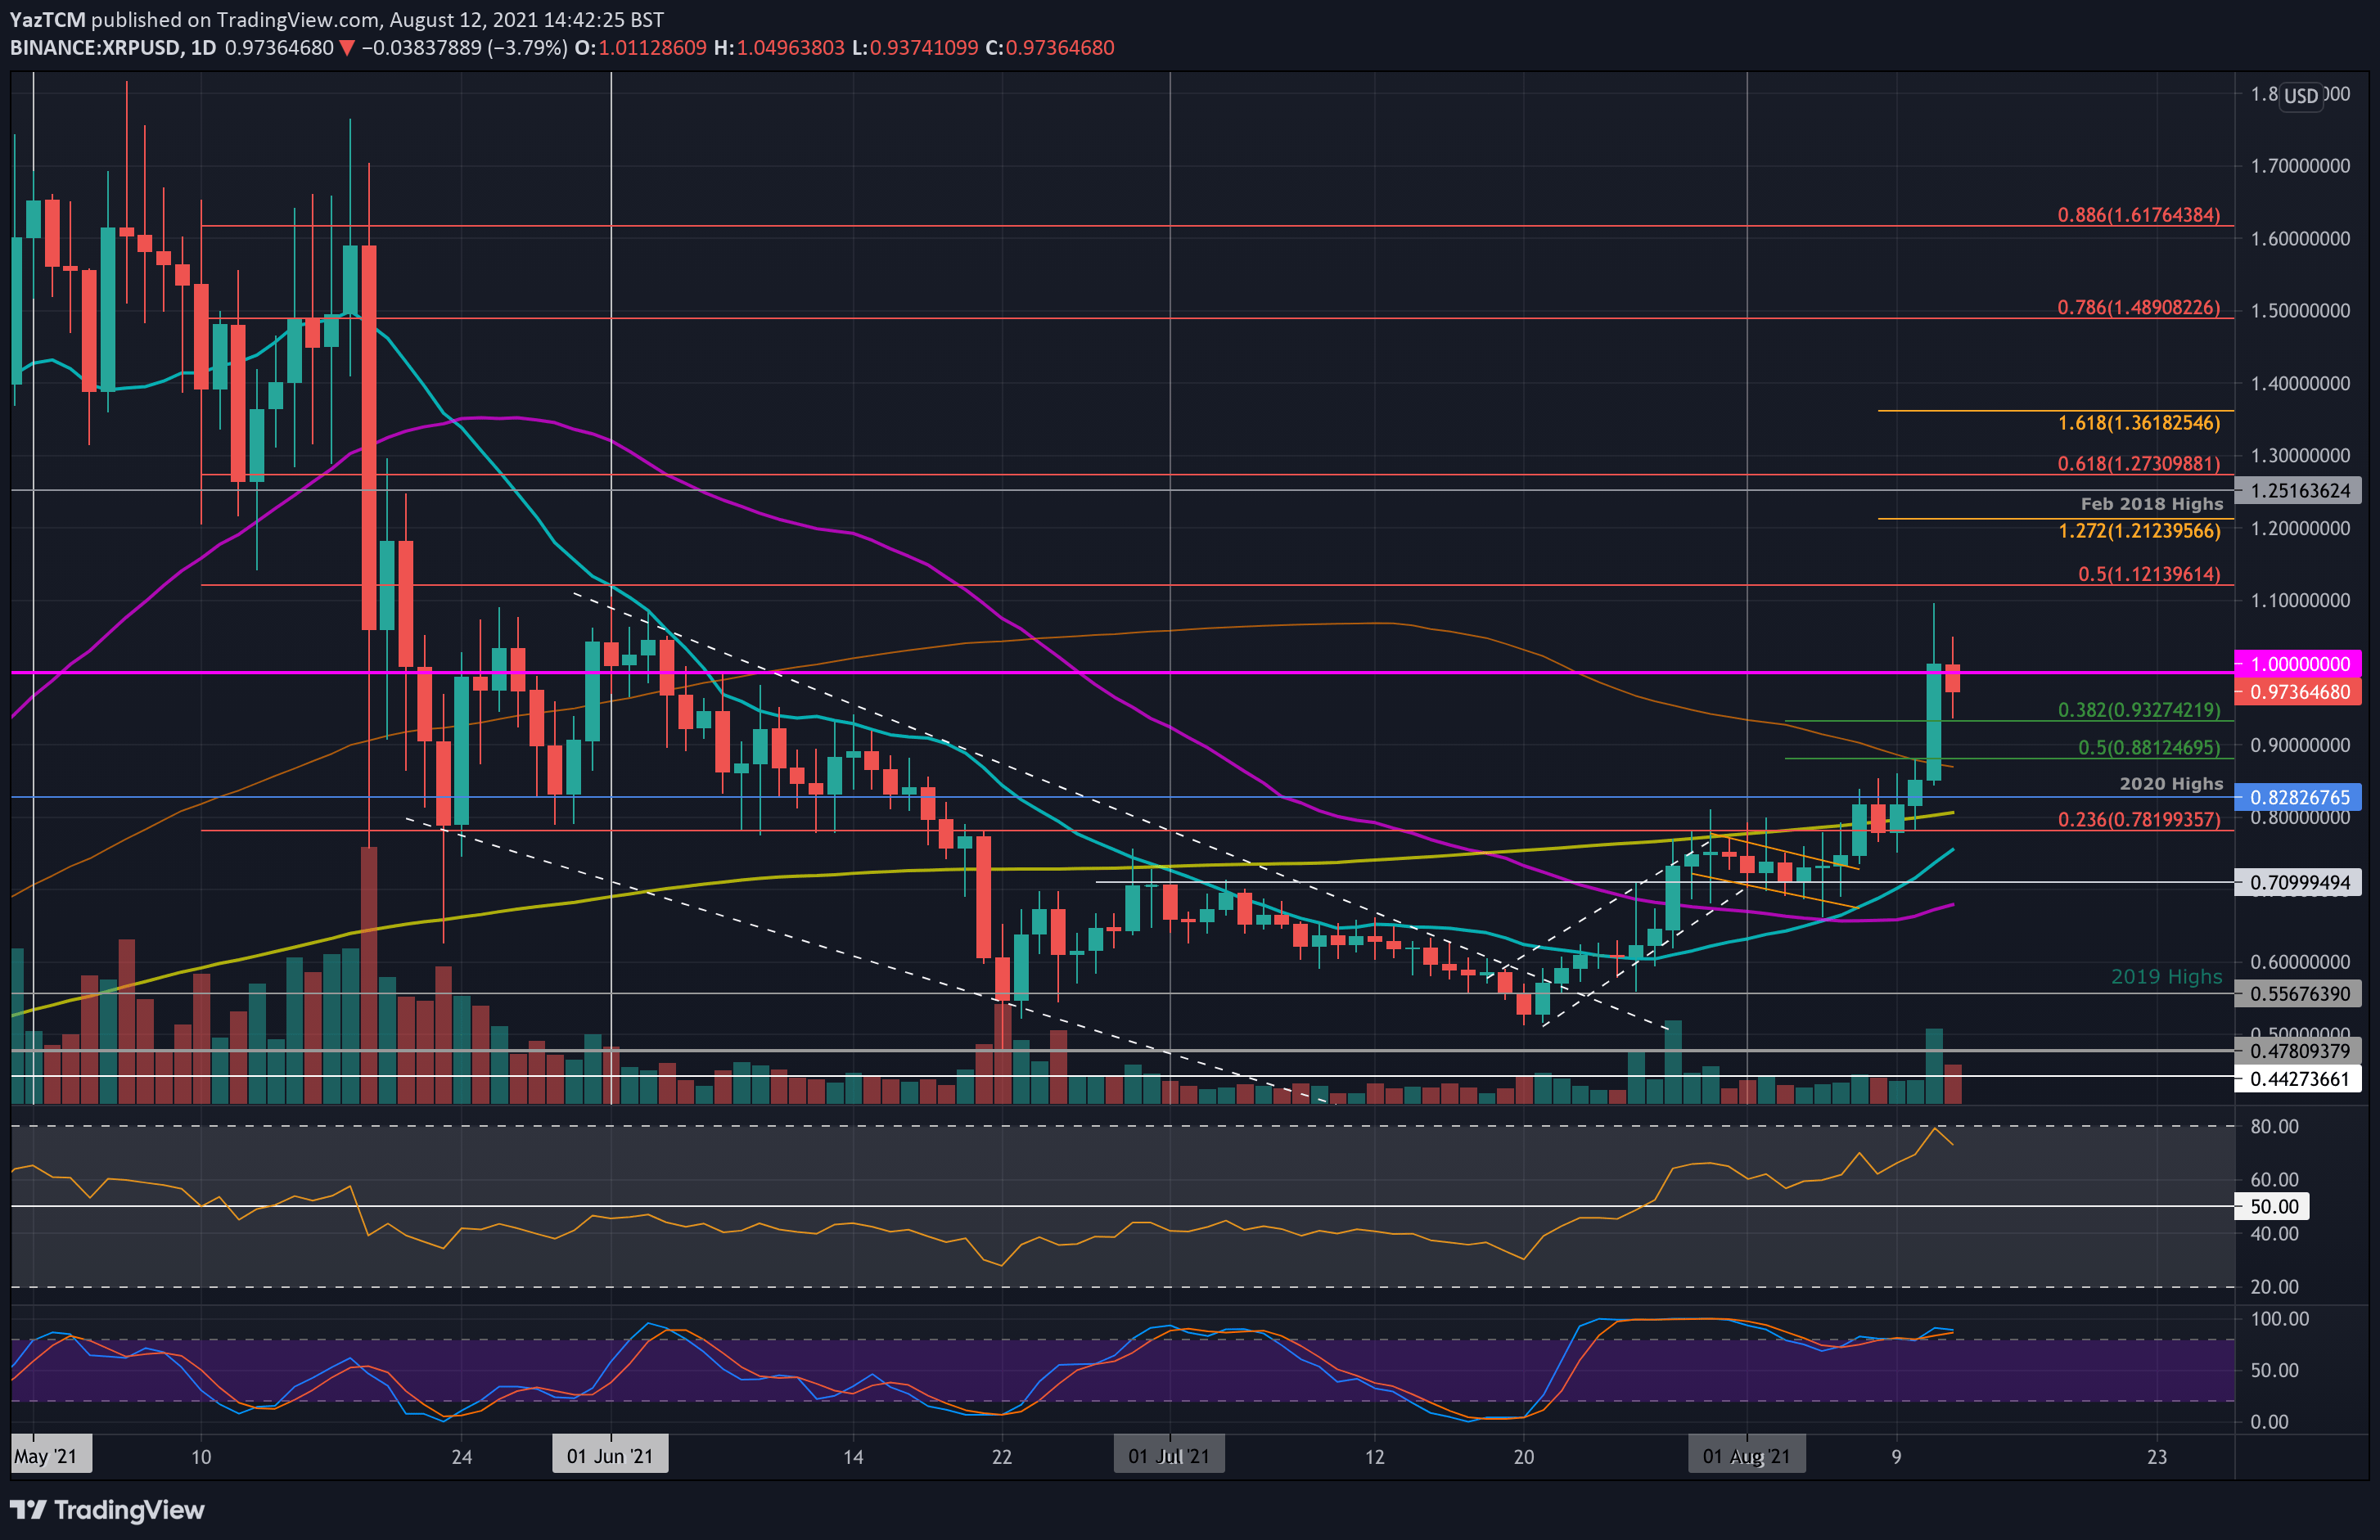
Since breaking the bullish flag pattern at the start of August, XRP climbed above the 200-day MA and the 2020 highs of $0.8282 to hit the 100-day MA.
The 100-day MA was finally breached yesterday after Ripple announced a partnership with GME Remittance. The partnership caused XRP to surge beyond the 100-day MA at $0.88, break $1, and reach as high as $1.10.
XRP has since dropped back beneath $1.00 but found support at $0.93 (.382 Fib) today and has since rebounded to $0.97. It’s important for bulls to breach above $1 as soon as possible. XRP is also up about 32% on the weekly.
XRP-USD Short Term Price Prediction
Looking ahead, if the buyers break back above $1, the first resistance lies at $1.10 (yesterday’s high * bearish .5 Fib). Above this, resistance lies at $1.21 (1.272 Fib Extension), $1.27 (bearish .618 Fib & Feb 2018 highs), and $1.36 (1.618 Fib Extension).
On the other side, the first support lies at $0.932 (.382 Fib). This is followed by $0.88 (.5 Fib & 100-day MA), $0.8282, and $0.8 (200-day MA(.
The RSI is in the bullish favor and is still not yet overbought, indicating the buyers still have some gas in the tank to push higher.
XRP/BTC – XRP Hits 100-day MA Resistance.
Key Support Levels: 2100 SAT, 2000 SAT, 1900 SAT.
Key Resistance Levels: 2200 SAT, 2520 SAT, 2515 SAT.
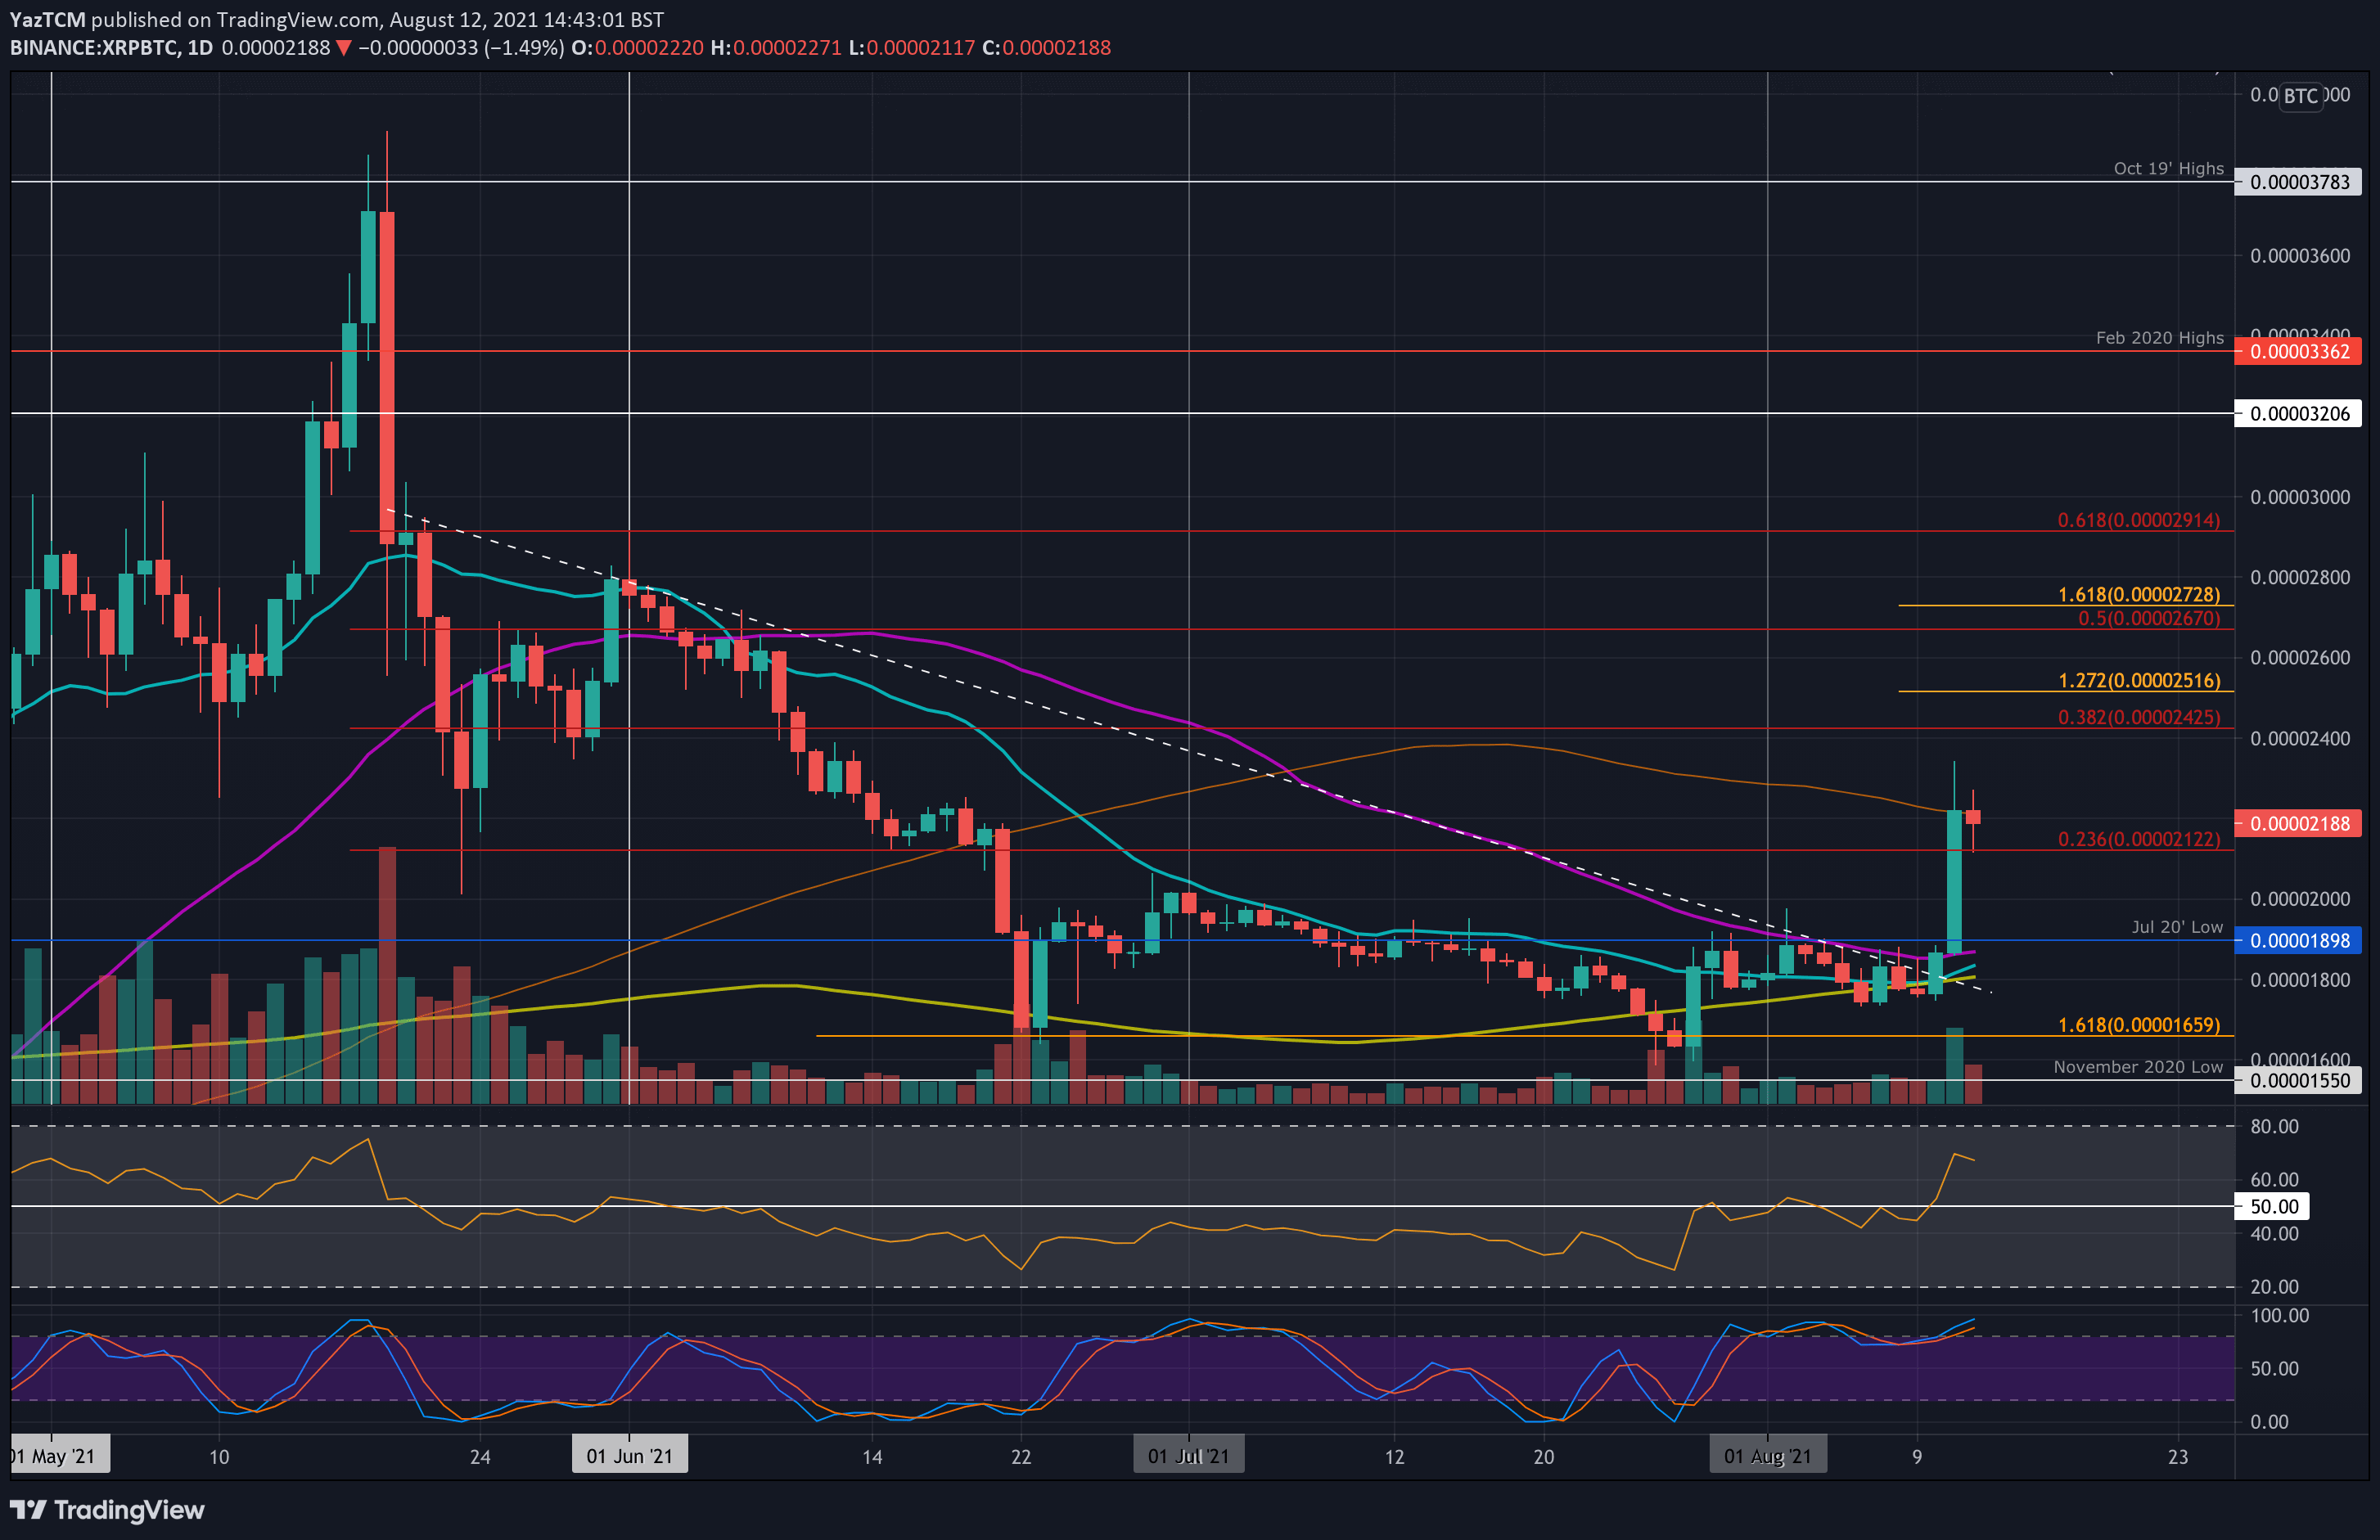
Against BTC, XRP was trading beneath a long-term descending trend line for most of the past two months. In addition, the resistance provided by the 50-day MA further bolstered the trend line.
On Tuesday, XRP finally broke above the descending trend line and headed to the 50-day MA. It continued above the 50-day MA and surged above 2000 SAT to reach as high as 2345 SAT. By the end of the day, XRP dropped to 2200 SAT, where it closed the daily candle at the 100-day MA.
XRP-BTC Short Term Price Prediction
Looking ahead, the first resistance lies at 2200 SAT (100-day MA). This is followed by 2420 SAT (bearish .382 Fib), 2515 SAT (1.272 Fib Extension), 2670 SAT (bearish .5 Fib), and 2800 SAT.
On the other side, the first support lies at 2100 SAT. This is followed by 2000 SAT, 1900 SAT, and 1800 SAT (200-day MA).
The daily RSI is now the highest it has been since mid-May, indicating the buyers are in full control of the market momentum.


