Ripple Price Analysis: XRP (Still) Struggling at $0.40 While Creating Fresh 2019 Lows Against Bitcoin
The stagnation continues for XRP despite the insignificant 0.5% price increase of the past week. XRP has struggled to gain any ground above the $0.40 level but continues to be nicely supported at $0.38 where the 100 and 200-day EMAs lie.
Ripple’s XRP remains the second largest cryptocurrency by market value with a market cap of $16.87 billion. XRP has seen an increase of approximately 17% over the past 3 months. However, this is lackluster compared to Ethereum’s 76% surge over the same period.
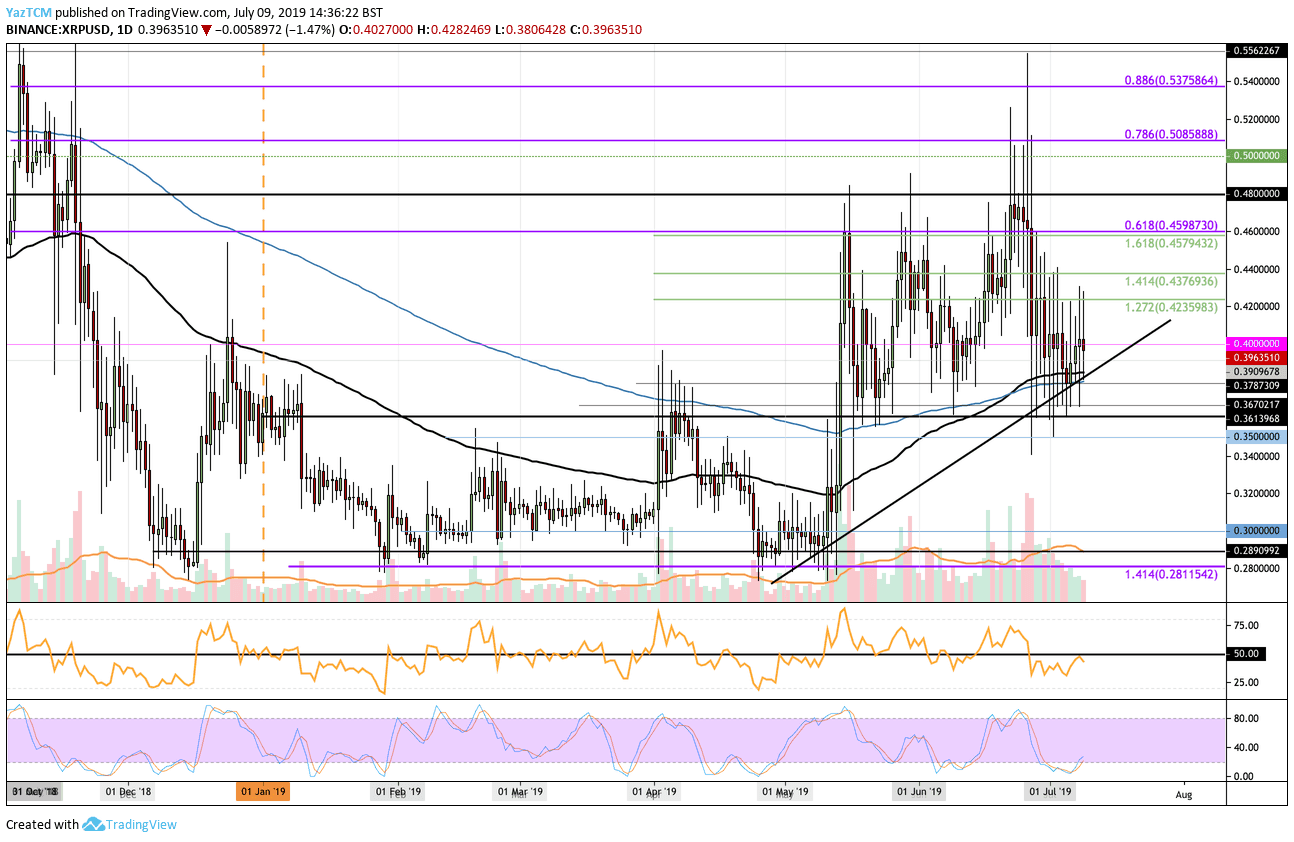
Looking at the XRP/USD 1-day chart:
- Even though XRP spiked above $0.40 since our previous XRP/USD analysis, the coin has been unsuccessful in closing above that level. XRP has been strongly supported at the $0.3787 level where the 200-day EMA and a 3-month-old rising trend line both lie.
- From above: The nearest level of resistance is $0.40. If the bulls can close above $0.40, the next levels of resistance are $0.4235, $0.4376, and $0.46 (the bearish .618 Fib retracement level). Above $0.46, further resistance lies at $0.48 and $0.50.
- From below: The nearest levels of support lie at $0.39 and $0.38. The support around $0.38 is considered substantial due to the convergence of the 100-day EMA, 200-day EMA, and a rising trend line. Below $0.38, further support lies at $0.3670, $0.36, and $0.35.
- The trading volume has continued to decline during July.
- The Stochastic RSI recently produced a bullish crossover signal in oversold territory which is a strong bullish sign. However, the RSI recently failed to move above 50, which shows that the sellers are still in control of the market.
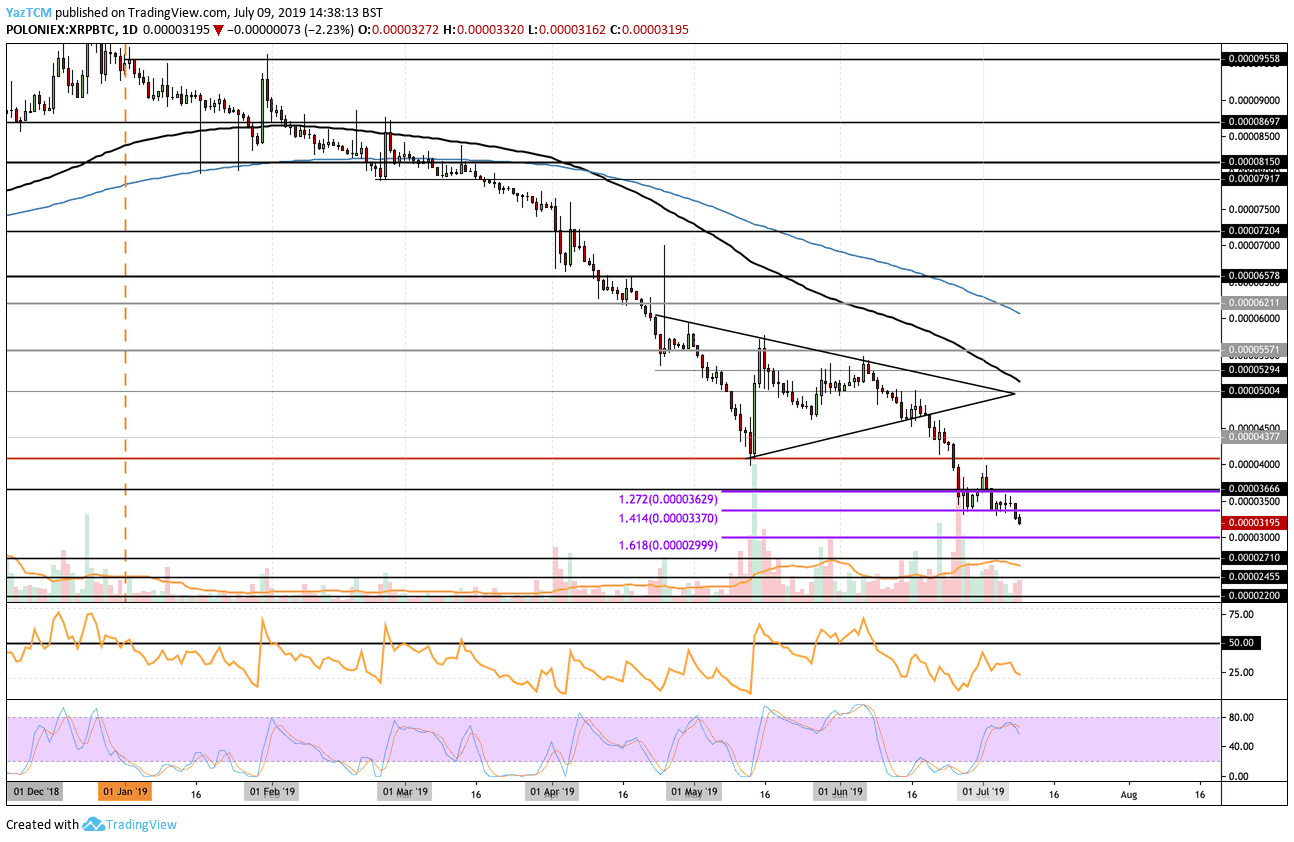
Looking at the XRP/BTC 1-day chart:
- Against Bitcoin, XRP has continued to struggle and even created fresh 2019 and 19-month lows at the same time as it dropped beneath the support at 3,370 satoshi to reach 3,195 sat.
- From above: The nearest resistance levels are 3,370 sat and 3,629 sat. Above this, resistance lies at 3,666 sat and 4,000 sat. If the buyers continue above 4,000 sat, the next resistance levels are 4,377 sat, 4,500 sat, 4,800 sat, and 5,000 sat.
- From below: The nearest levels of support are 3,100 sat and 3,000 sat. Beneath 3,000 sat, support can be found at 2,710 sat, 2,455 sat, and 2,200 sat.
- The trading volume is diminishing but remains relatively high compared to the start of the year.
- The RSI remains well under 50, indicating that the bears are in control. For the XRP/BTC market to recover, we will need to see the RSI rise above 50.
The post Ripple Price Analysis: XRP (Still) Struggling at $0.40 While Creating Fresh 2019 Lows Against Bitcoin appeared first on CryptoPotato.