Ripple Price Analysis: XRP Skyrockets 10% in 2 Days but is the Rally Over?
Ripple’s price is finally showing bullish momentum on the USDT and BTC pairs as it has taken out significant resistance levels. Yet, there’s still much work to do.
XRP Price Analysis
By Edris Derakhshi (TradingRage)
The USDT Paired Chart
Against USDT, the Ripple price has been reeling since it rebounded from the $0.5 support level, breaking above the 200-day moving average (around $0.55) and the critical $0.66 mark. The cryptocurrency is finally on its way to testing the $0.7 resistance zone.
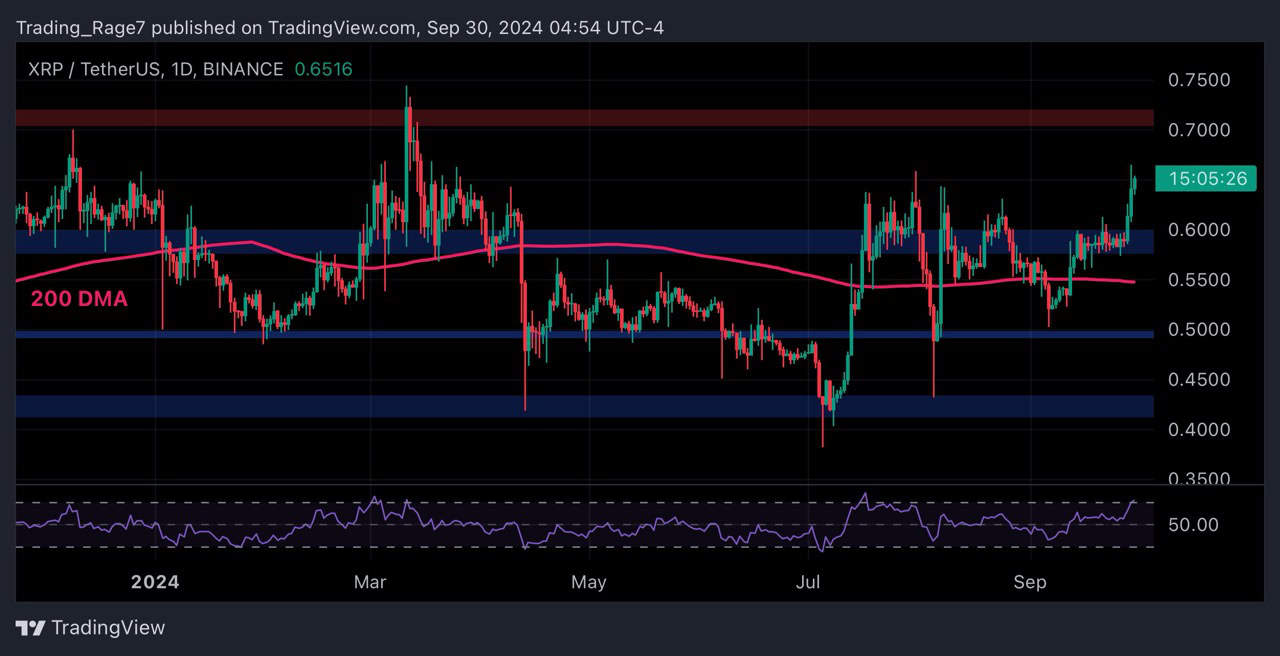
However, the RSI is approaching the overbought region, a caution signal that could indicate a potential pullback soon.
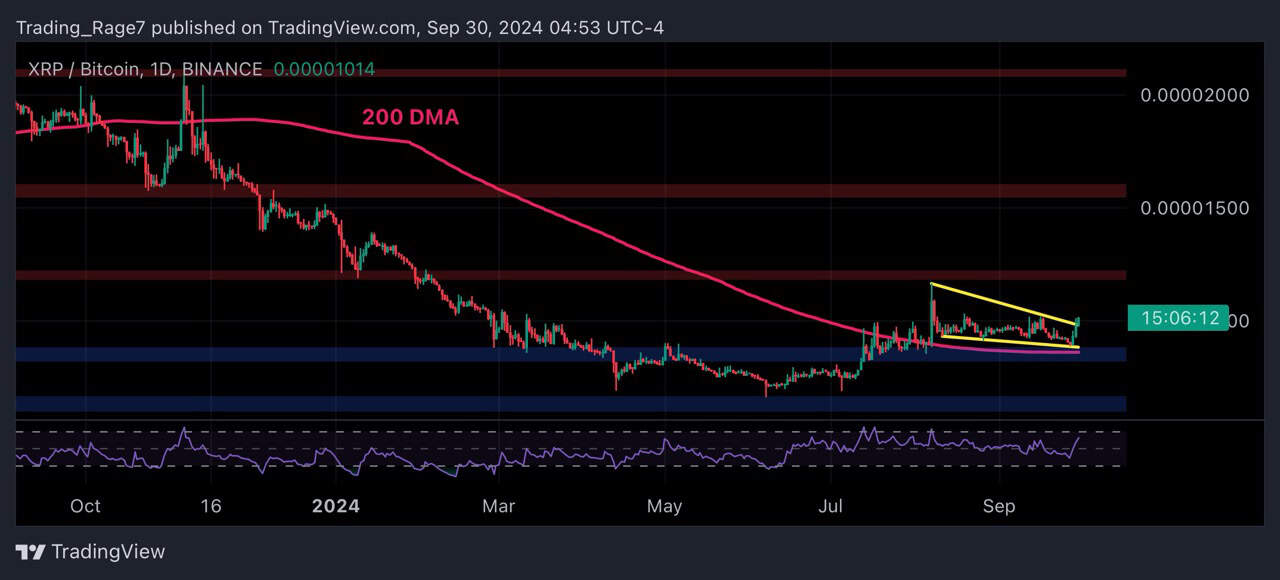
The BTC Paired Chart
The XRP/BTC chart shows that the price has been consolidating in a bullish flag pattern since breaking above the 800 SAT resistance level. This area has now become support, as the market has already retested it.
The bullish flag’s upper boundary is now on the verge of being broken to the upside, which could lead to the market rallying toward the 1200 SAT resistance level in the coming weeks.
The post Ripple Price Analysis: XRP Skyrockets 10% in 2 Days but is the Rally Over? appeared first on CryptoPotato.