Ripple Price Analysis: XRP Joins The Party With Over 40%, The Reversal?
Ripple has seen a significant price increase over the past seven days, which total over 43% dollar-wise, bringing the price for the cryptocurrency up to the $0.43 price area.
The remarkable recent growth has now pushed Ripple out of its previous stagnant price movement and into a bullish setting after creating a fresh 2019 price high.
Ripple is ranked in the 3rd place amongst the top cryptocurrency coins by market cap value as it presently holds an $18.16 billion market cap.
Looking at the XRP/USD 1-Day Chart:
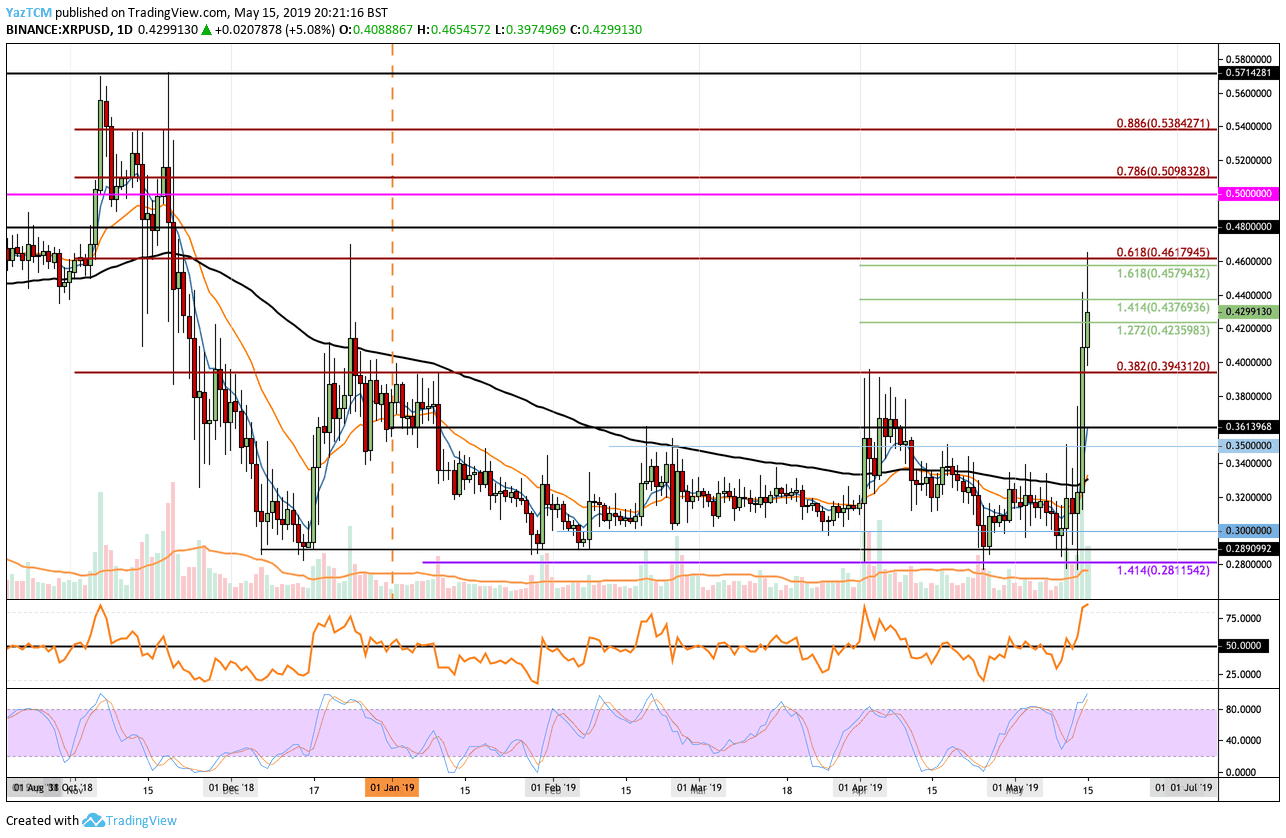
- Against the US Dollar, we can see the stationary sideways movement that XRP/USD was trading between January 2019 and May 2019. However, the recent price surge marked a break-up above the 100-day moving average and head significantly higher to where it is currently trading at resistance around $0.43.
- From above: The closest resistance lies at $0.44 and then $0.46, along with a long term bearish .618 Fibonacci Retracement level. Further resistance lies at $0.48, $0.50, and $0.5384.
- From below: Initial support lies at $0.42 and $0.40. Beneath $0.40, further support lies at $0.3943, $0.38, $0.3615 and $0.35.
- The trading volume has seen a significant increase over the past two days during following the recent surge.
- The RSI has now reached the overbought territory, which could indicate that the bulls may be exhausted at this moment and a healthy correction might be coming soon.
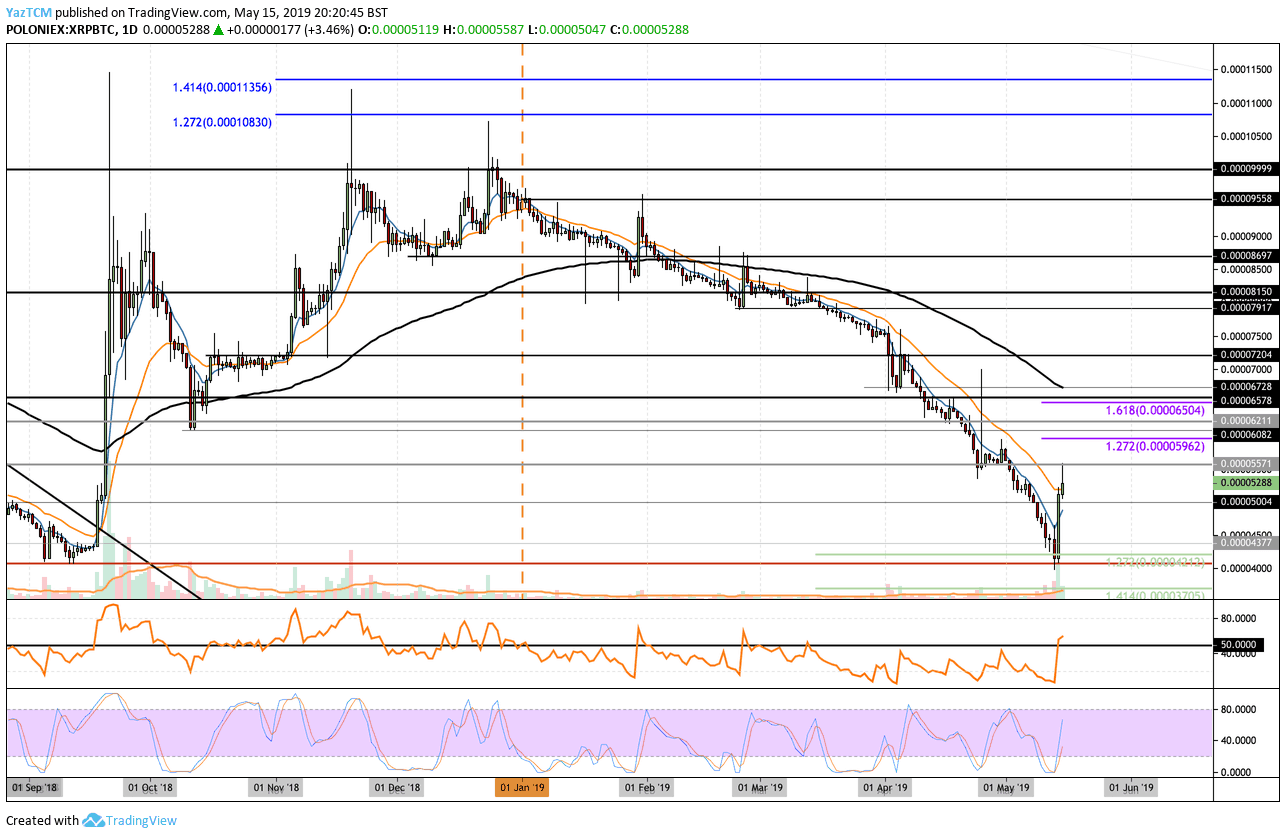
Looking at the XRP/BTC 1-Day Chart:
- Against Bitcoin, we can see XRP/BTC had continued to fall further lower until finding long-term support around the 4000 SAT price level. This price level had provided strong support for the market during December 2018. XRP/BTC is now trading close to the 5300 SAT resistance mark.
- From above: The nearest level of resistance lies at 5570 SAT and 6000 SAT. Further resistance lies at 6211 SAT, 6578 SAT, 6728 SAT (also the 100-day moving average line) and 7000 SAT.
- From below: The nearest level of support lies at 5000 SAT. Beneath lie 4500 SAT, 4377 SAT and 4000 SAT support levels.
- The RSI has recently managed to penetrate above the 50 levels for the first time since late February 2019, which is a strong bullish signal. Furthermore, the Stochastic RSI has recently initiated a crossover signal in the oversold territory, which is a robust bullish signal.
The post Ripple Price Analysis: XRP Joins The Party With Over 40%, The Reversal? appeared first on CryptoPotato.

