Ripple Price Analysis: XRP Forms Bullish Pattern, Eyeing $4 Surge
Ripple’s price has been rallying higher over the past few months, and this is true against both USDT and BTC.
Yet, as the technical charts suggest, XRP could rise even higher in the near future.
By Edris Derakhshi (TradingRage)
The USDT Paired Chart
On the USDT paired chart, the third-largest cryptocurrency has been making higher highs and lows over the past few months, breaking above multiple resistance levels. At the moment, the market is gradually rising inside a rising wedge, which is mostly considered a bearish reversal pattern.
Yet, if the pattern is broken to the upside, an aggressive rally could be expected in the coming weeks, which could see XRP trade above the $4 mark.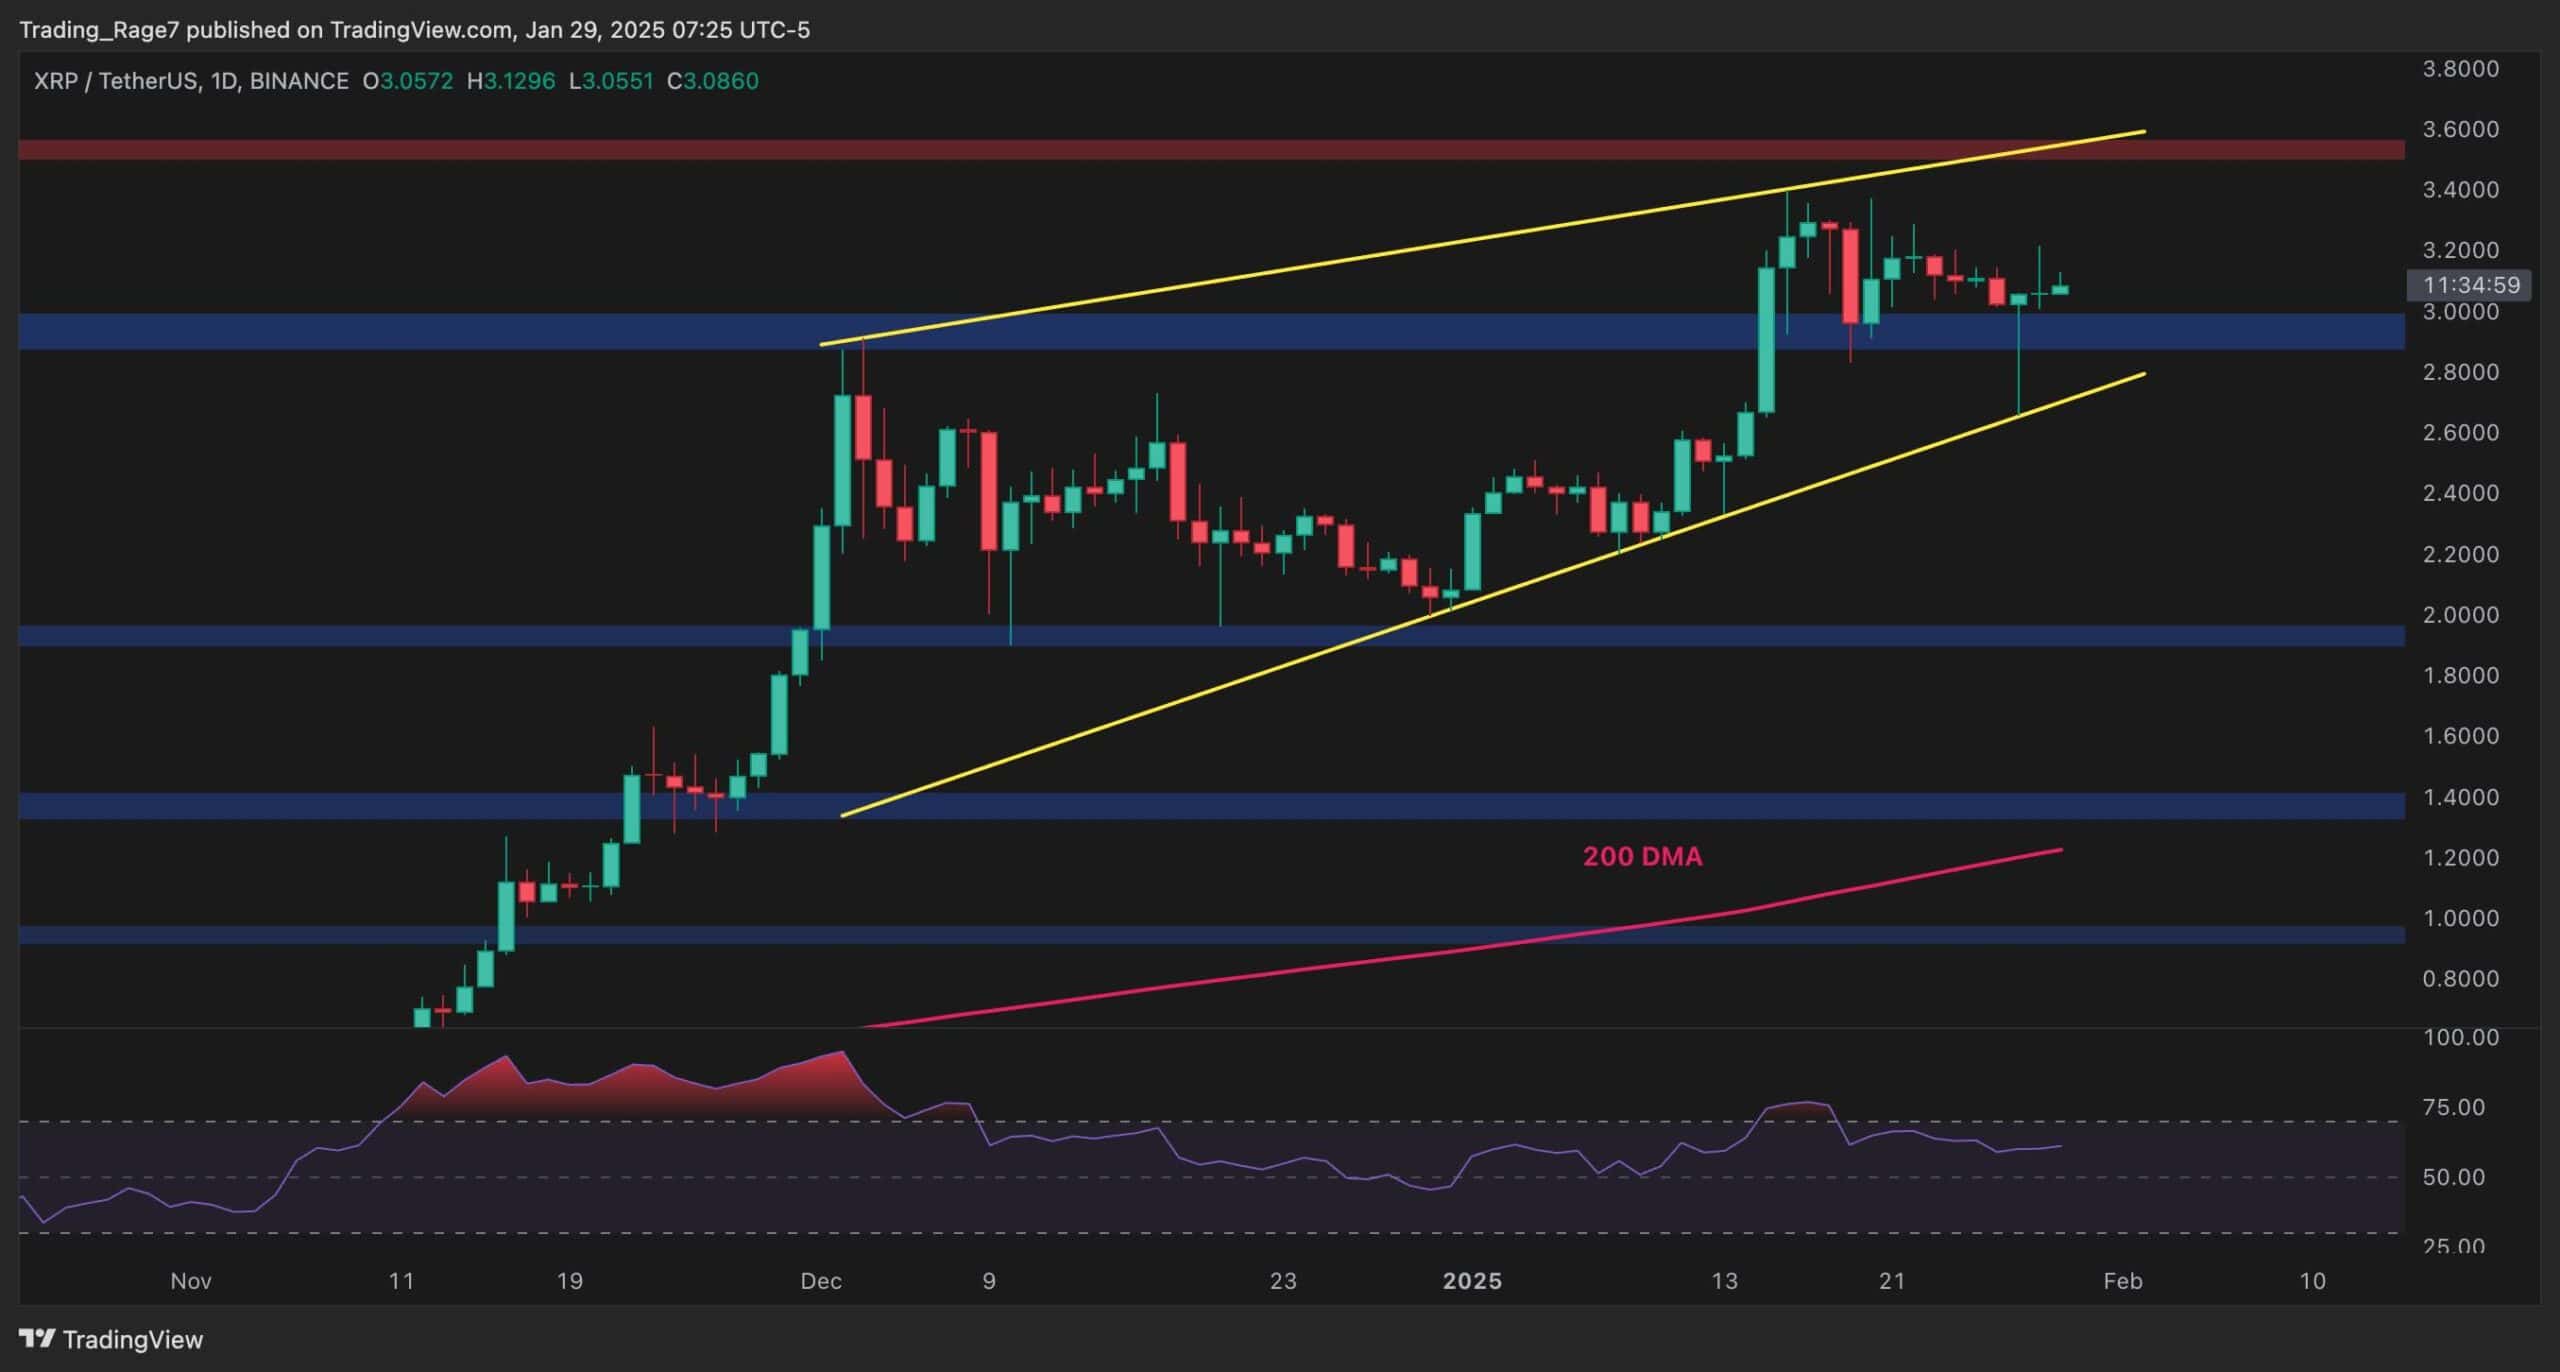
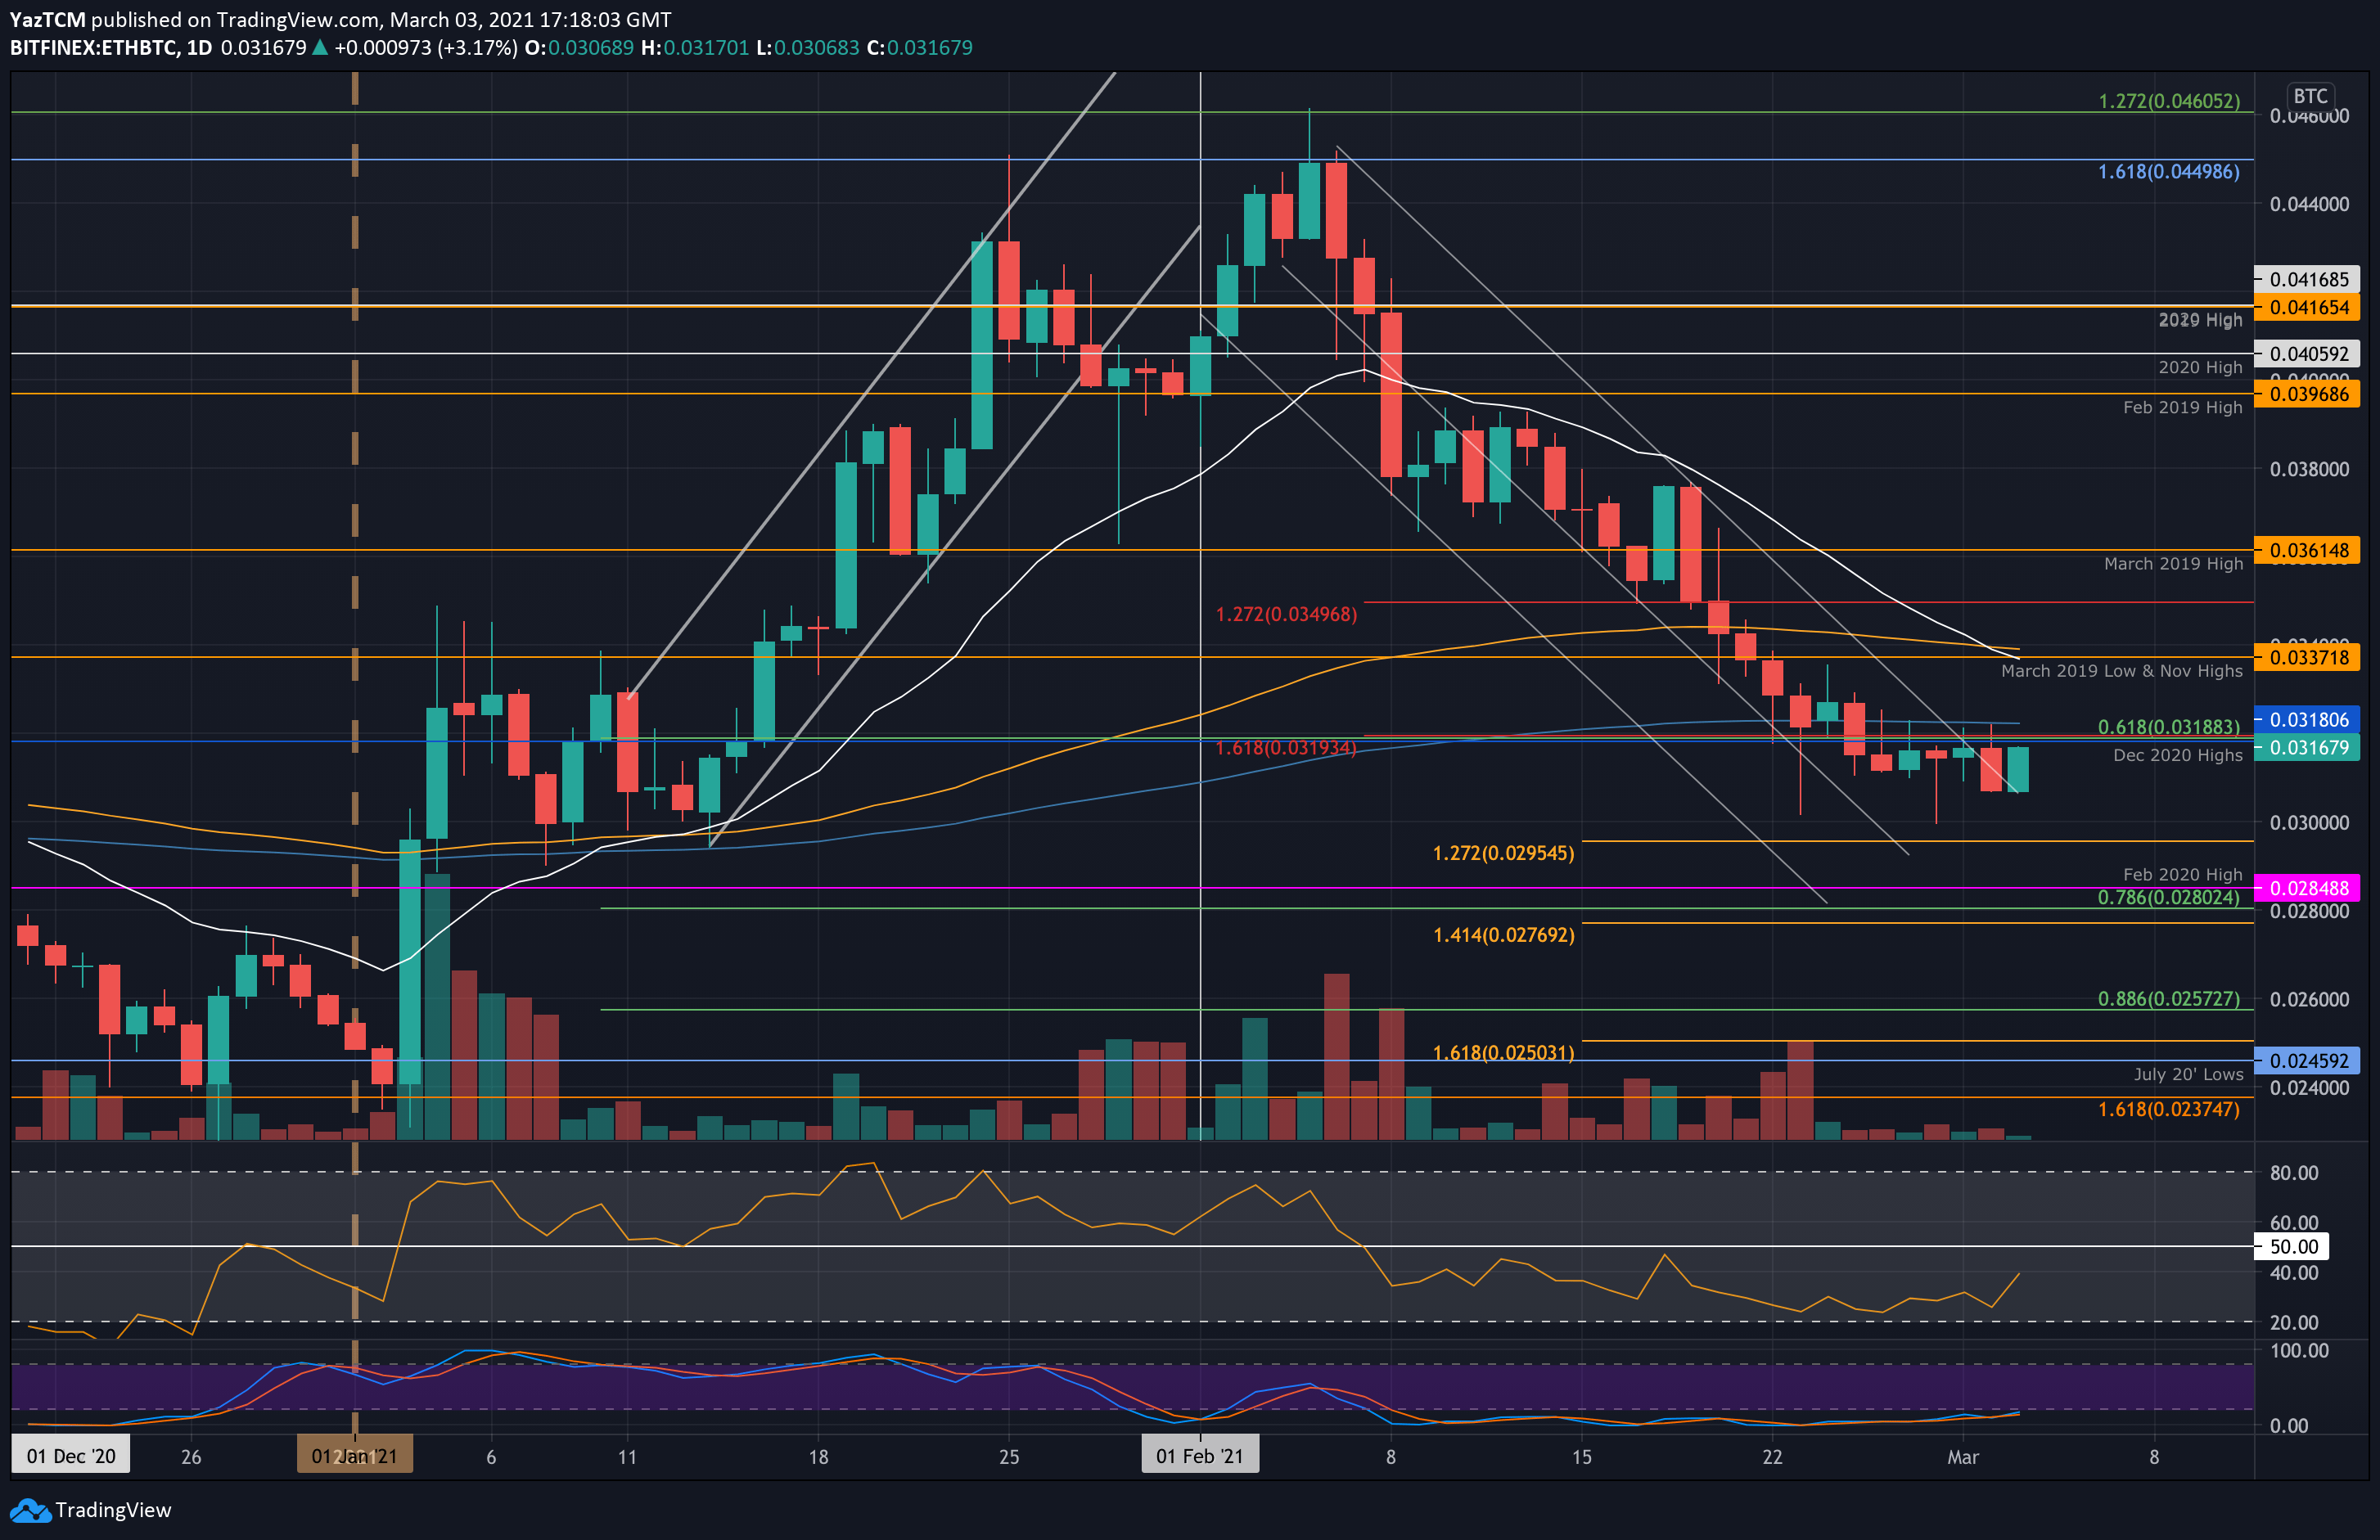
The BTC Paired Chart
Things look quite similar on the BTC paired chart, as an ascending channel pattern has been formed on the XRP/BTC pair. Like the USDT pair, while this pattern is a bearish one, it could enter a significantly bullish phase if the channel is broken to the upside.
The RSI is also demonstrating values above 50%, which indicates a bullish continuation is more likely than a reversal.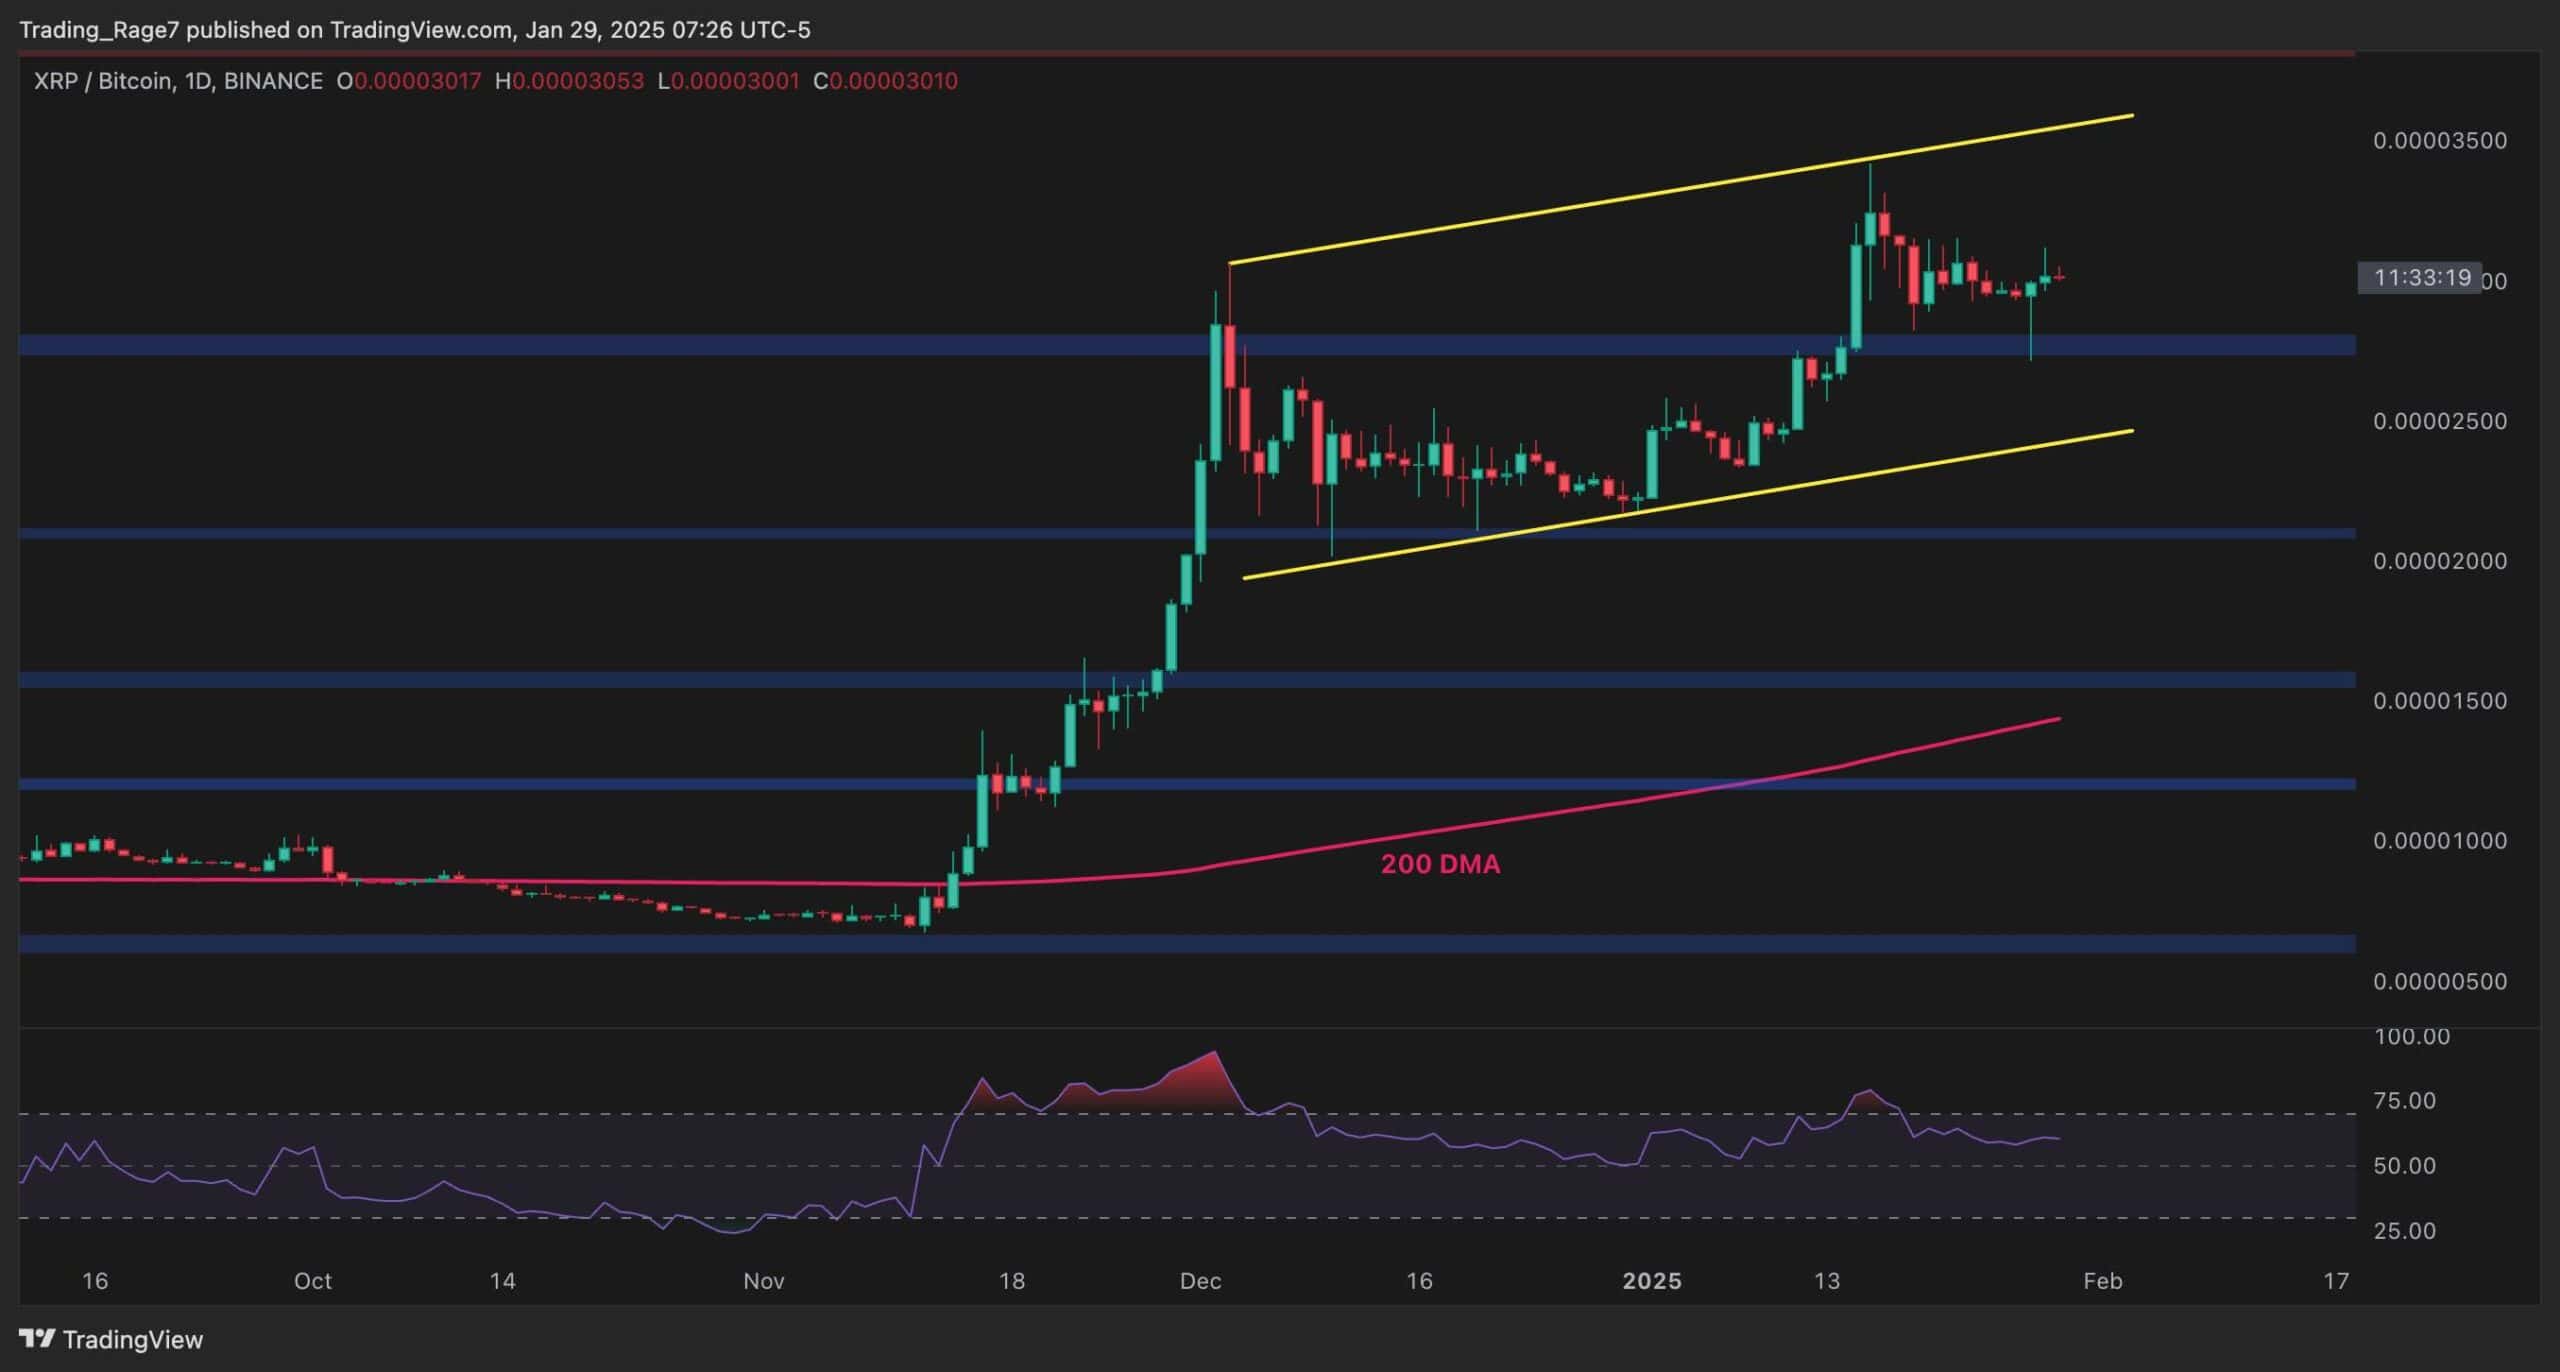
The post Ripple Price Analysis: XRP Forms Bullish Pattern, Eyeing $4 Surge appeared first on CryptoPotato.