Ripple Price Analysis: XRP Facing Critical Support, What’s Next?
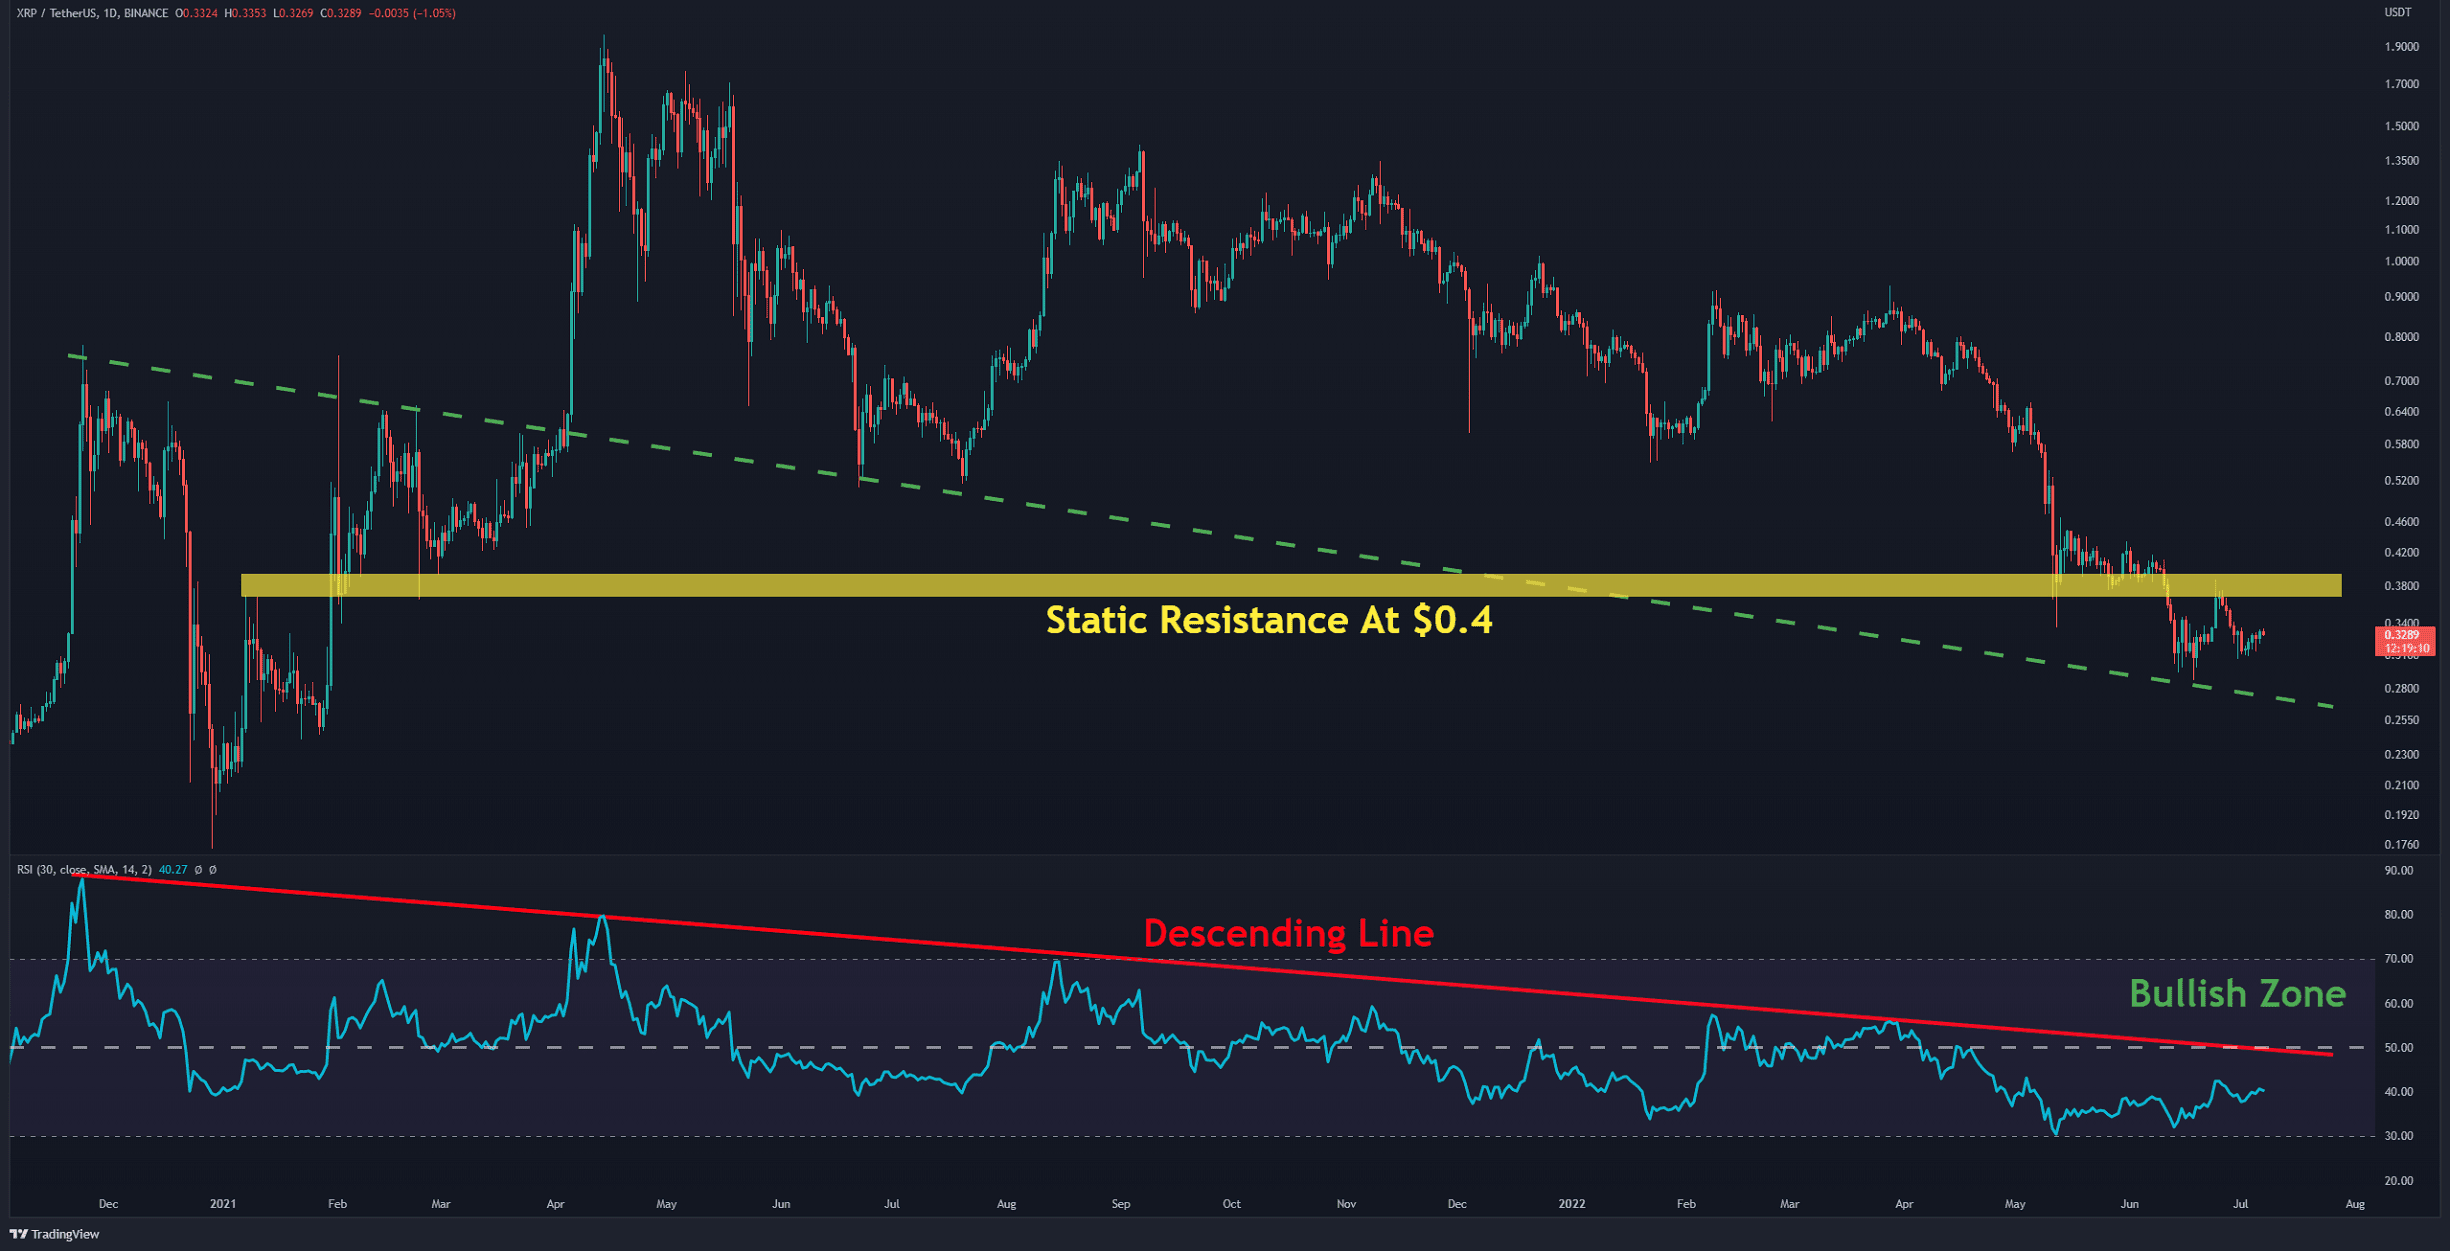
On the daily timeframe, Ripple trades on top of the dynamic support (in green). By adding the RSI 30-day indicator, it can be seen that this index is in the bearish zone and moving up towards the descending line as resistance (in red). This resistance trendline was formed at the end of 2020.
Back to the price: Looking from the bullish side, the bull’s first challenge will be to break above the horizontal resistance at $0.4 (marked yellow). After failing in one attempt, if the next one will succeed in breaking – the RSI is also expected to cross its corresponding resistance and trigger a positive signal for an upward rally.
Holding support at $0.3 is critical for XRP. If the bears retake market control and push the price below it, a correction to the $0.24 range is likely.
Key Support Levels: $0.30 & $0.24
Key Resistance Levels: $0.40 & $0.54

Moving Averages:
MA20: $0.33
MA50: $0.37
MA100: $0.51
MA200: $0.64
Technical Analysis By Grizzly
The XRP/BTC chart
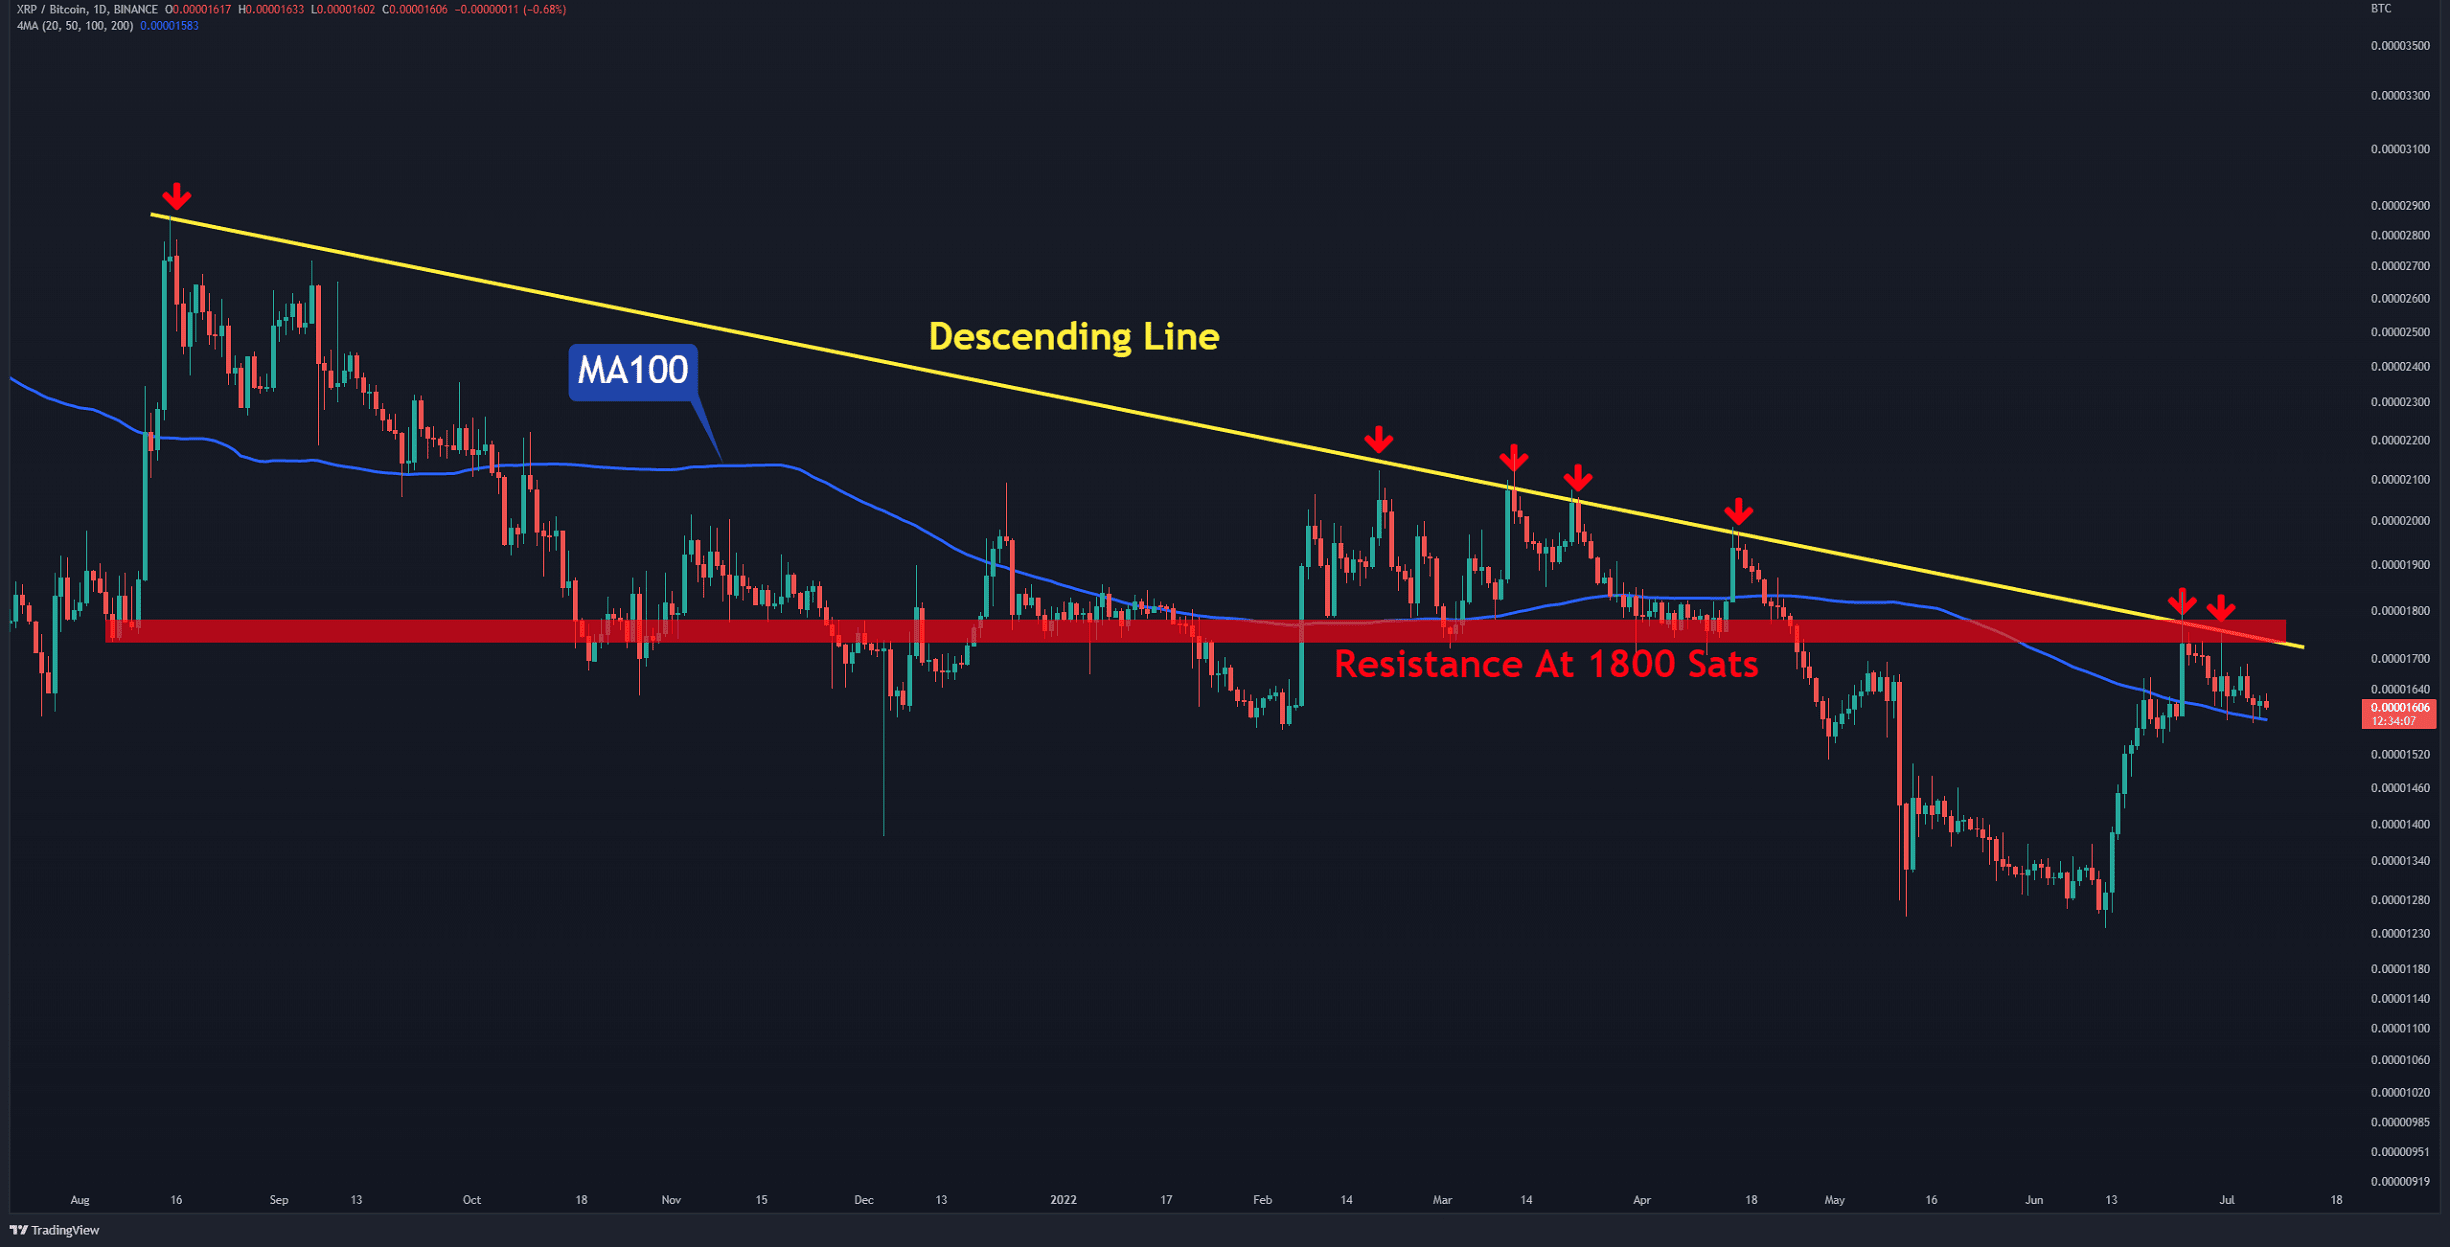
The BTC pair chart’s price is still trading below the yellow descending line. At the same time, the daily MA100 (in blue) has provided significant support.
Ripple’s main challenge remains to break above the resistance zone at 1800 Sats. In case of a breakout, 2000 Sats should be imminent.
Key Support Levels: 1500 Sats & 1250 Sats
Key Resistance Levels: 1700 Sats & 1800 Sats


