Ripple Price Analysis: XRP Drops Beneath EMA-200, Will $0.30 Hold?
XRP has seen a small price rebound over the past 24 hours, marking an increase of around 3.3%. This allowed the cryptocurrency to get to its current price at around $0.3455. The latest move comes after XRP dropped beneath a rising trend line after decreasing by a total of 10% over the past week.
Ripple remains the 3rd largest cryptocurrency with a market cap of $14.72 billion. However, the cryptocurrency continues to fall heavily against BTC and for any recovery to occur, we will need to see XRP/BTC reversing.
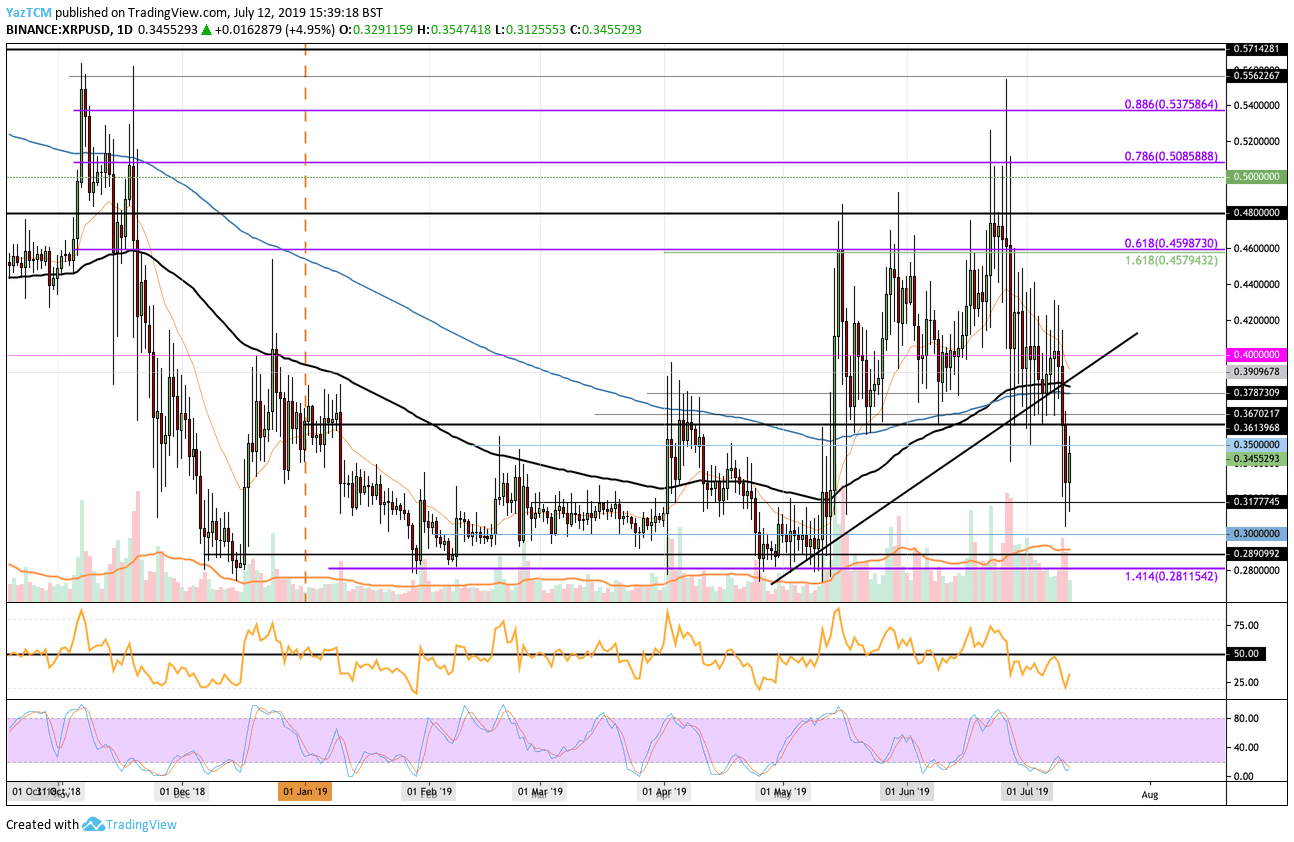
Looking at the XRP/USD 1-Day Chart:
- Since our previous XRP/USD analysis, XRP fell beneath the rising trend line which we have been tracking. XRP had also dropped below both the support provided by the 100 days EMA and 200 days EMA. Its price XRP went as low as $0.303 before the rebound took place to bring it back up to $0.3455.
- From above: The nearest level of resistance lies at $0.35. Above this, higher resistance lies at $0.3612, $0.3670, and $0.38. The resistance at $0.38 is considered very strong due to the 100 day EMA and 200 day EMA being closely located in this area. Above $0.38, further resistance lies at $0.3909 and $0.40.
- From below: The nearest level of support now lies at $0.33, $0.32 and $0.3177. Beneath this, lower support is found at $0.31 and $0.30. The support at $0.30 should be very strong as it has provided support for the market during 2019 and 2018. If XRP does fall below $0.30, we do not expect it to stay beneath the level for very long and we can find support at $0.29, $0.2890, and $0.2810.
- The trading volume has increased over the past few days during the recent round of selling.
- The Stochastic RSI and the RSI itself are both in oversold conditions. We will need to wait for a bullish crossover signal on the Stochastic RSI to indicate that a push higher is about to get started.
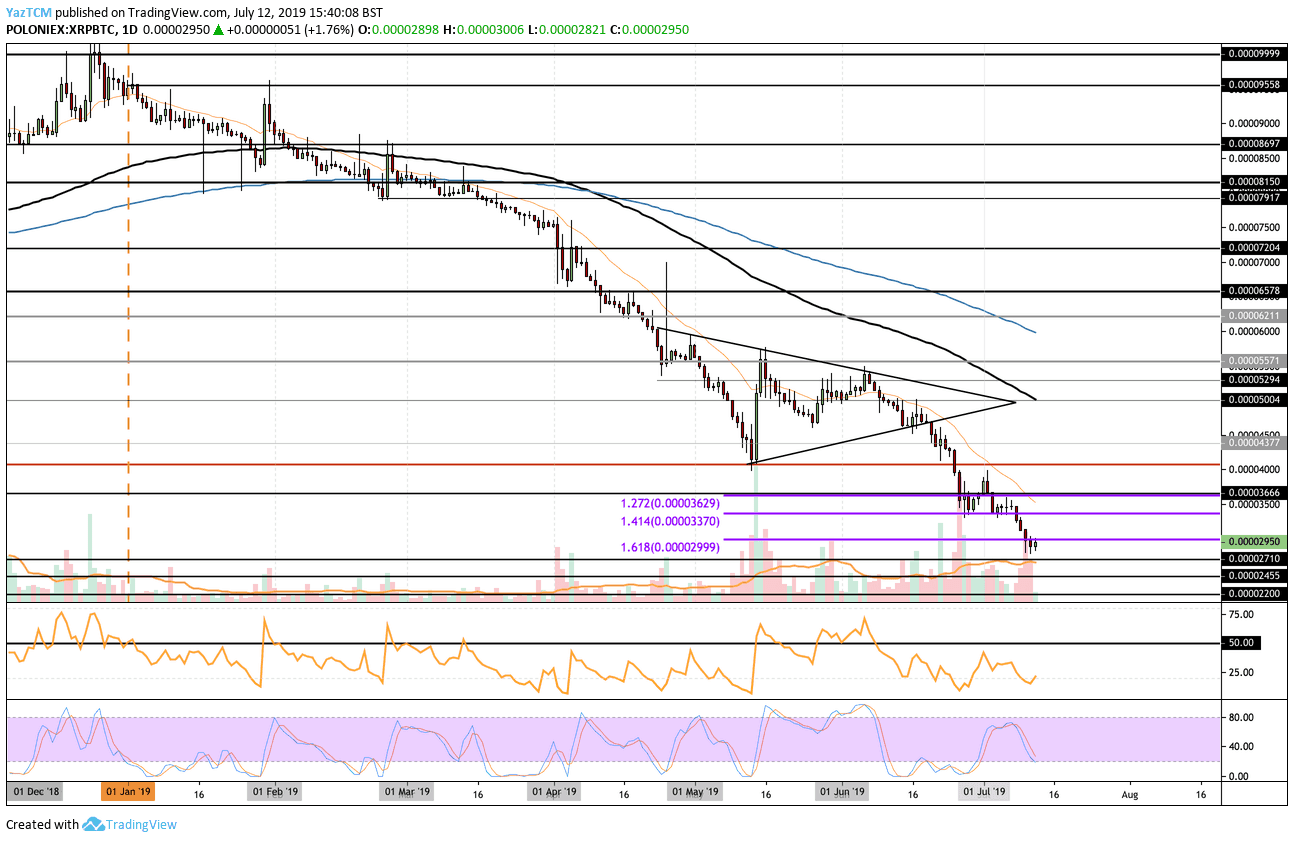
Looking at the XRP/BTC 1-Day Chart:
- Against Bitcoin, we can see that XRP continued to suffer, dropping below the expected support at 3000 SAT briefly. XRP has been consistently falling against BTC all year round, creating fresh lows as the year progresses. We can see that XRP/BTC rebounded slightly as it now trades at 2950 SAT.
- From above: The nearest level of resistance lies at 3000 SAT. Above this, higher resistance is found at 3370 SAT, 3630 SAT, 3666 SAT, and 4000 SAT. Above 4000 SAT, further resistance lies at 4377 SAT, 4500 SAT, and 5000 SAT.
- From below: The nearest level of support now lies at 2890 SAT. Beneath this, support is located at 2710 SAT, 2455 SAT, 2200 SAT, and 2000 SAT.
- The trading volume has also increased significantly as XRPBTC makes fresh 2019 lows.
- The Stochastic RSI is in oversold conditions also, as we wait for a bullish crossover signal to push the market higher.
The post Ripple Price Analysis: XRP Drops Beneath EMA-200, Will $0.30 Hold? appeared first on CryptoPotato.

