Ripple Price Analysis: XRP Downturn Might Come to End as Positive Signs Start to Pop
Key Support levels: $0.75
Key Resistance level: $1
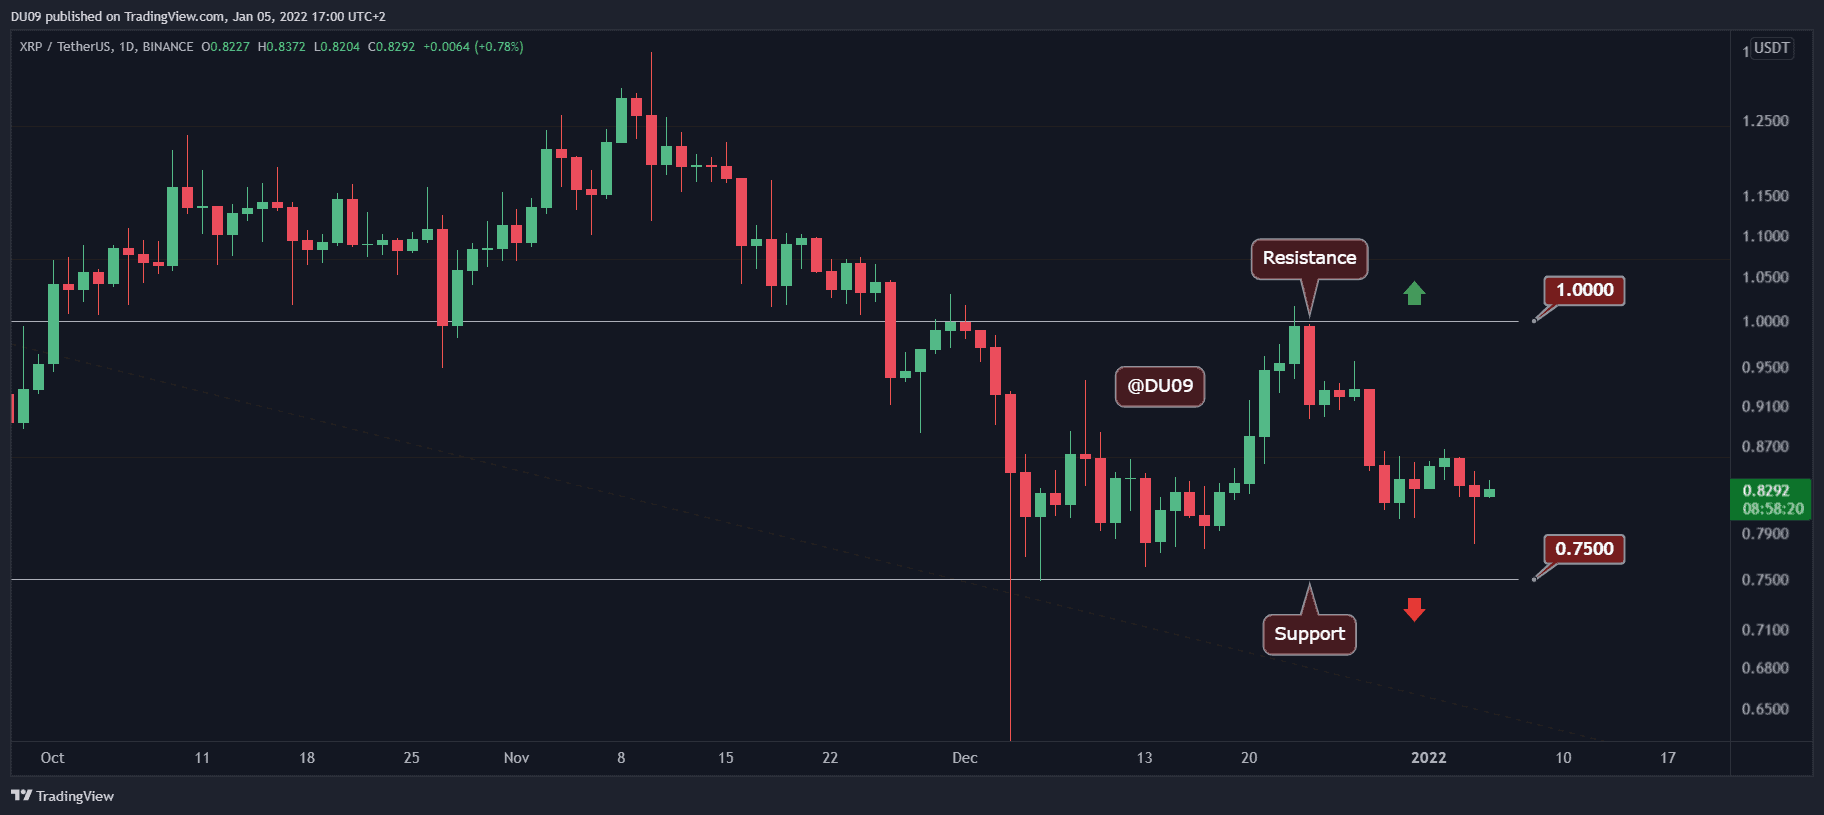
XRP had a difficult week, with the price slowly falling back towards the key support level at $0.75. While other altcoins such as Chainlink are making significant gains, XRP still struggles to find its footing. The resistance at $1 will likely not be tested any time soon considering this price action.

Technical Indicators
Trading Volume: The volume has decreased as the price went lower, showing weakness in the bearish trend. This is good news, as XRP may attempt a reversal soon.
RSI: The daily RSI has made a higher low. This also gives hope that XRP may finally return on the uptrend and attempt another break of the key resistance.
MACD: The daily MACD remains bearish, but the histogram shows a lack of conviction from the sellers. For this reason, MACD can quickly do a bullish crossover if buyers return in force.

Bias
The current XRP bias is neutral. While the price action is somewhat bearish, there is no conviction on either side to push price up or down in any significant way.
Short-Term Prediction for XRP Price
XRP may have reached the end of this correction after the sharp rejection at the $1 resistance level. The lack of volume shows this. For this reason, buyers may soon have a good opportunity soon to bring up the pace.


