Ripple Price Analysis: XRP Crashes 17% Following Bitcoin’s Bloodbath, Where To Now?
- Ripple turned bearish after losing 17% to reach a key demand level at $0.175
- There’s no bullish sign for XRP at the moment as bears show more interest
- Against Bitcoin, Ripple dropped to a new monthly low at 2130 SAT level
XRP/USD: Ripple Drops To $0.175
Key Resistance Levels: $0.20, $0.222, $0.235
Key Support Levels: $0.175, $0.163. $0.146
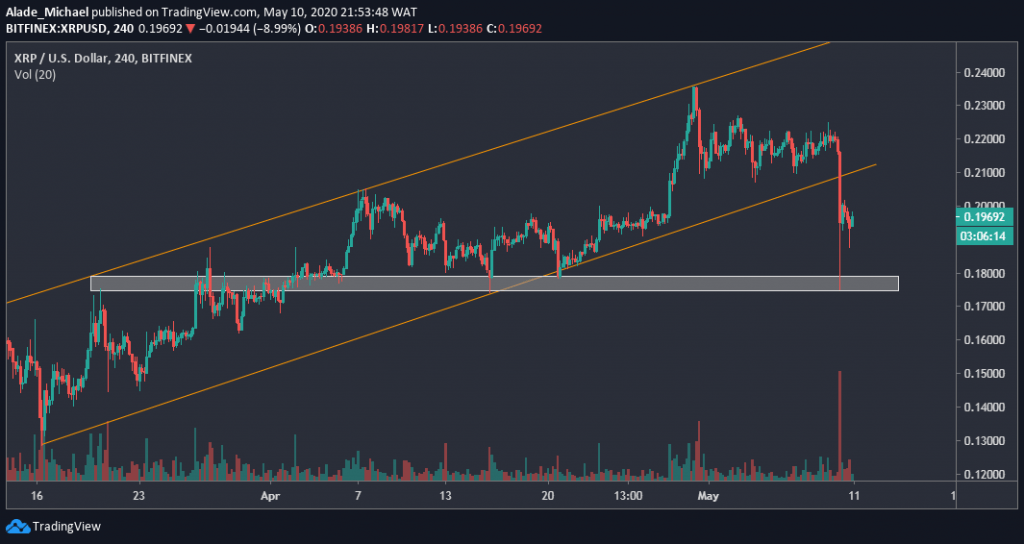
Ripple saw a daily 17% drop to $0.175, following a sudden collapse in the entire cryptocurrency market. In anticipation of the much-anticipating Bitcoin halving, this drop is now providing a big opportunity for the XRP bulls to accumulate.
The dump was followed by a sharp breakdown from the ascending channel that was shaping bullish actions for the past weeks. Ripple is now looking bearish on the 4-hours chart.
The third-largest cryptocurrency is now trading around $0.198, following a quick rejection at the grey demand area. XRP is likely to regain momentum if this demand area can hold strong. The bearish scenario could get worse if the price drops lower.
Ripple Price Analysis
The long wick at $0.175 – in the grey demand area – indicates slight exhaustion in selling. The following wick at $0.187 level also confirms a relief from the bears’ side for now.
But if volatility expands to the downside again, XRP may wipe off this grey area to $0.163, and $0.146 supports.
If the buyers act upon the rejection from $0.175 and $0.187 level, however, XRP could see a nice bounce to $0.20. A continuous increase should bring a full recovery back to $0.222 and $0.235 resistance, printed on April 30.
XRP/BTC: Ripple Remains Trapped In a Channel
Key Resistance Levels: 2393 SAT, 2600 SAT, 2800 SAT
Key Support Levels: 2130 SAT, 2000 SAT, 1900 SAT
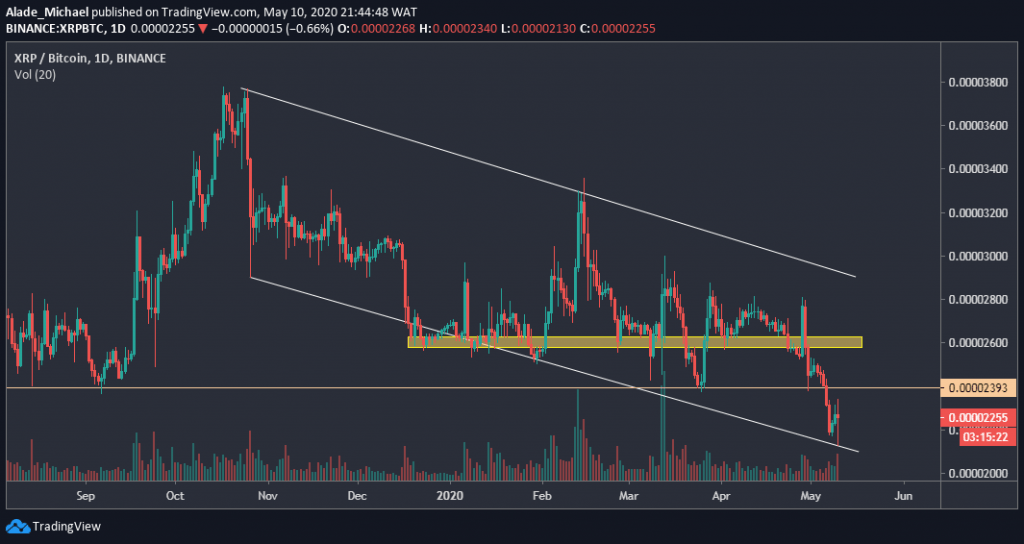
Ripple remained in a downward spiral against Bitcoin, and it is trading at around 2261 SAT at the time of writing. The XRP bulls are trying to push it back to the 2300 SAT level.
Still, the bearish trend appeared strong on the daily chart. But considering the sharp bounce from of 2130 SAT (today’s low), XRP may see a small push to the 2393 SAT support-turned-resistance level that got broken on May 6.
It’s also important to note that XRP has found support around the lower boundary of the channel, which suggests that a potential retracement could be underway.
Ripple Price Analysis
A push above the orange resistance line of 2393 SAT (2019 low) would allow a nice recovery to 2600 SAT, marked yellow on the daily chart. The price may reach the channel’s resistance at 2800 SAT if buying pressure increases.
Above the channel, resistance levels to keep an eye on are 3200 SAT and 3760 SAT in case of a breakup.
Towards the downside, Ripple pinned daily support at 2130 SAT. If the level breaks, fresh support may come around 2000 SAT or even 1900 SAT price area.
The post Ripple Price Analysis: XRP Crashes 17% Following Bitcoin’s Bloodbath, Where To Now? appeared first on CryptoPotato.


