Ripple Price Analysis: XRP Could Plunge to $1.6 if This Support Fails
Ripple’s price is experiencing a significant decline, alongside the whole crypto market, and is likely to continue dropping lower if Bitcoin fails to recover soon.
By Edris Derakhshi (TradingRage)
The USDT Paired Chart
On the daily chart of the XRP/USDT pair, the price has been trending lower following the rejection from the $3 resistance zone earlier in January.
Currently, the market is testing the $2 support level, and if a breakdown occurs, a further decline toward the 200-day moving average, located around the $1.6 mark, would be probable. Yet, with the RSI entering the oversold region, a consolidation or at least a bullish pullback could be expected in the coming weeks.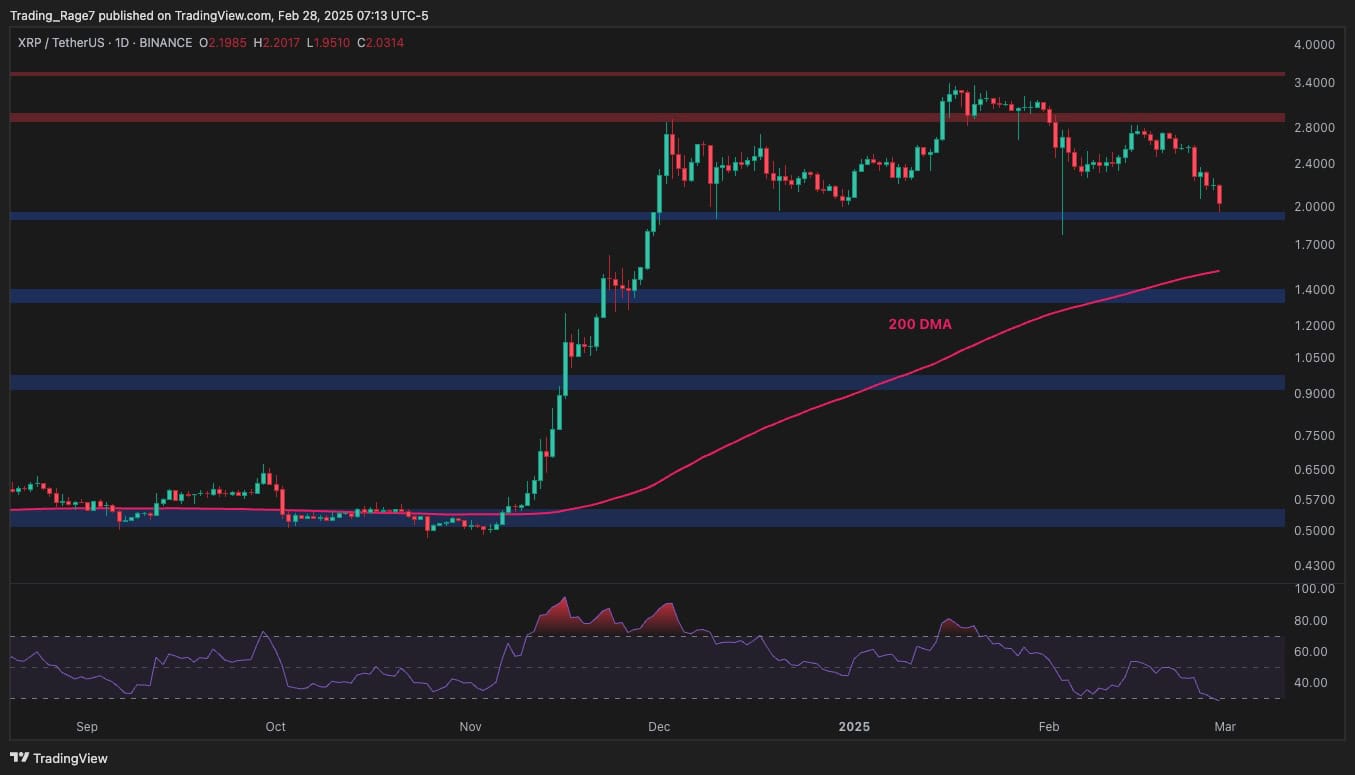
The BTC Paired Chart
Looking at the XRP/BTC pair, it is evident that Ripple is holding on better against Bitcoin, as the price has not experienced a considerable drop. Yet, this is mainly because BTC itself is currently experiencing a massive move lower.
Nevertheless, the 2000 SAT support level will likely be the upcoming XRP target, as the RSI is showing clear bearish momentum. The long-term outlook for XRP, however, will mostly depend on whether it is able to keep above the 200-day moving average, currently trending around the 1700 SAT area.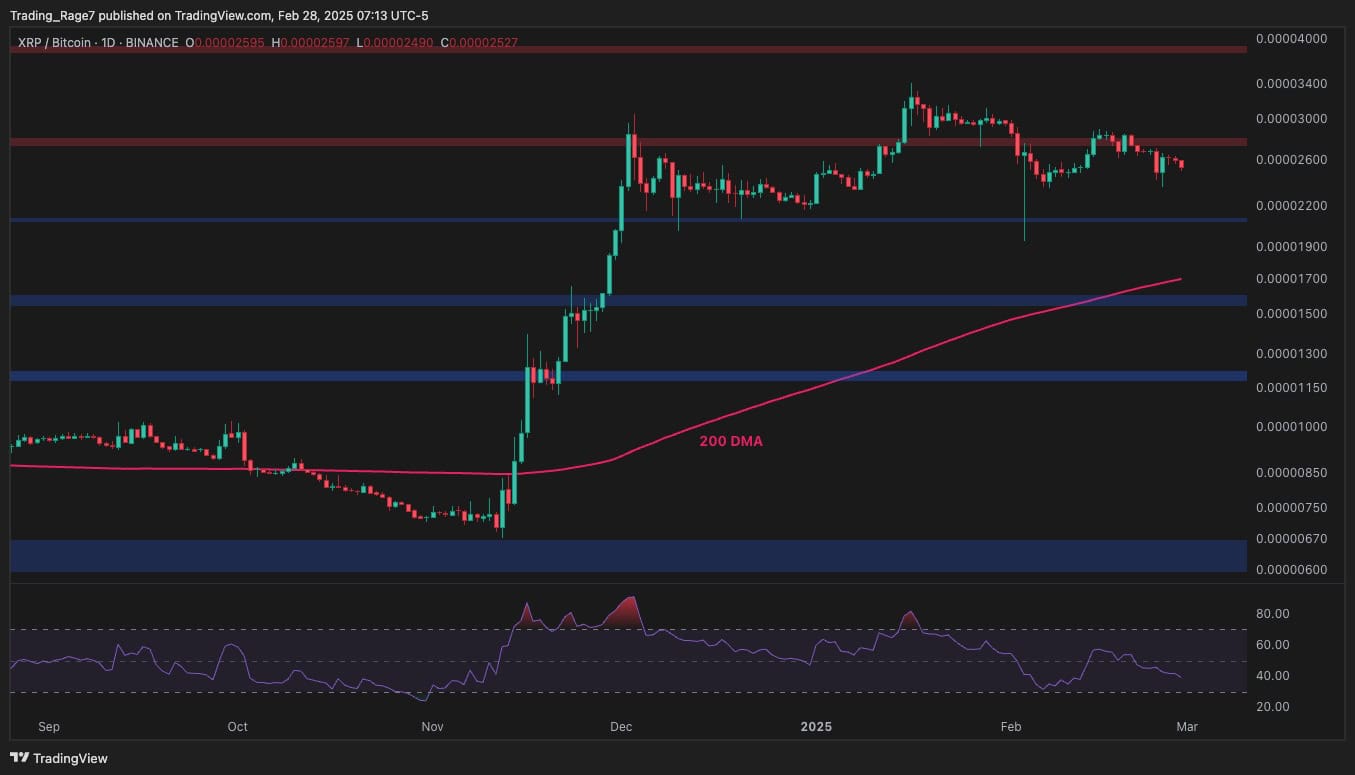
The post Ripple Price Analysis: XRP Could Plunge to $1.6 if This Support Fails appeared first on CryptoPotato.