Ripple Price Analysis: XRP Continues To Hold At $0.30, Are We Ready For A Move?
XRP continues to hold very strong at the $0.30 support. This level has allowed the market to remain above the $0.30 for the entire period of 2019 (except a few brief spikes beneath). However, it’s possible that the more the support persists, the more it’s likely to break as it continues to be tested. If XRP continues to abuse the $0.30 level as it has been doing, we can expect the market to collapse beneath at some point.
XRP remains the 3rd largest cryptocurrency with a market cap of $13.25 billion. It struggled this month, losing about 34% over the past 30 days.
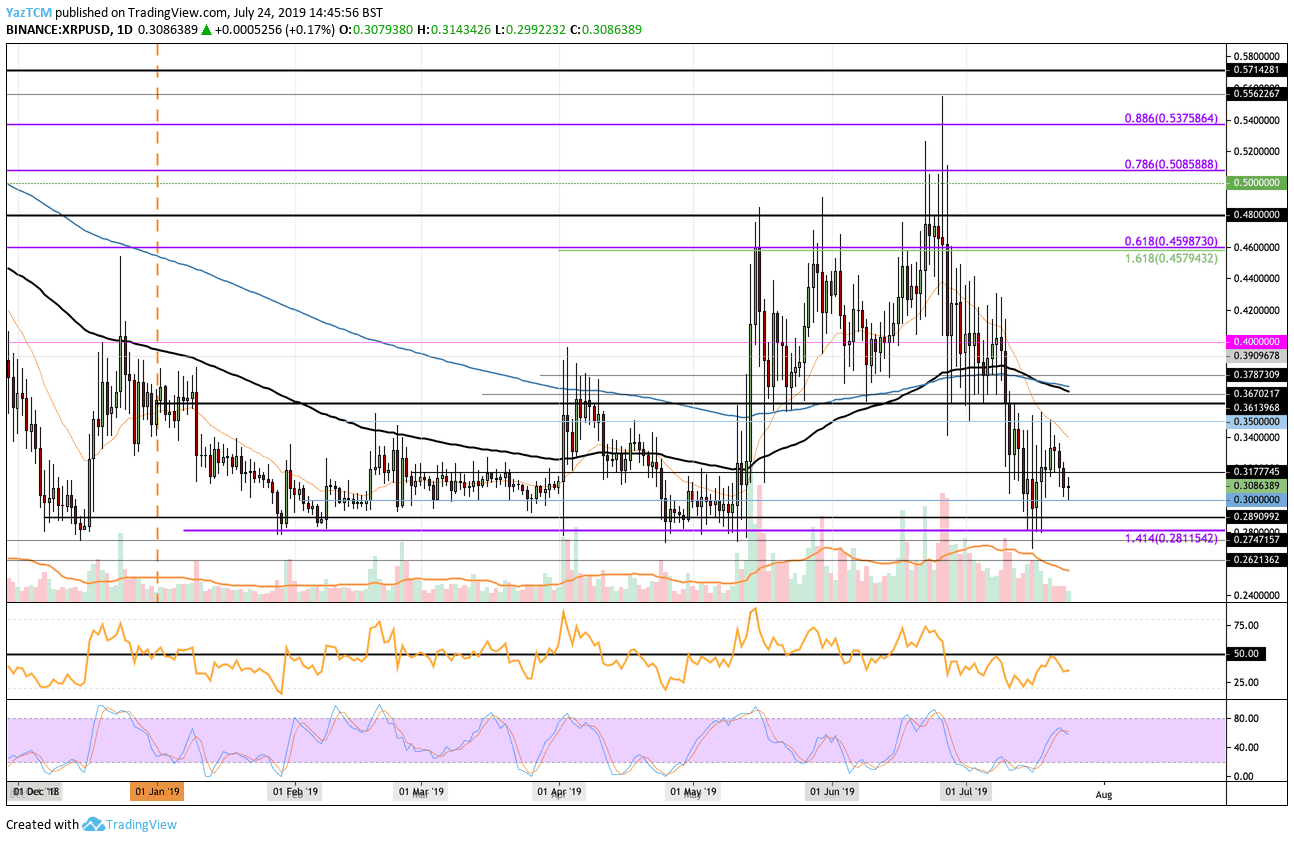
Looking at the XRP/USD 1-Day Chart:
- Since our previous XRP/USD analysis, XRPUSD continued to go above the resistance at $0.3177 to reach $0.35. However, the market was unable to push beyond that and has pulled back toward the $0.30 level.
- From above: The nearest levels of resistance lie at $0.3177, $0.34, and $0.35. If the bulls break above $0.35, higher resistance lies at $0.3610 and between $0.3670 – $0.37. This area of resistance is significant due to the 100 day and 200 day EMAs being located here. Above this, further resistance is found at $0.39, $0.40, $0.42, and $0.4598.
- From below: The nearest level of support lies at the $0.30 level. If the sellers drag the price beneath this support level we can expect further support at $0.2890, $0.2811, $0.28, $0.2750, and $0.2620.
- The RSI has recently been turned away from the 50 level which is a bad sign as it shows the bulls attempted to gain control of the market momentum but had failed to do so.
- The trading volume has also been steadily declining during July.
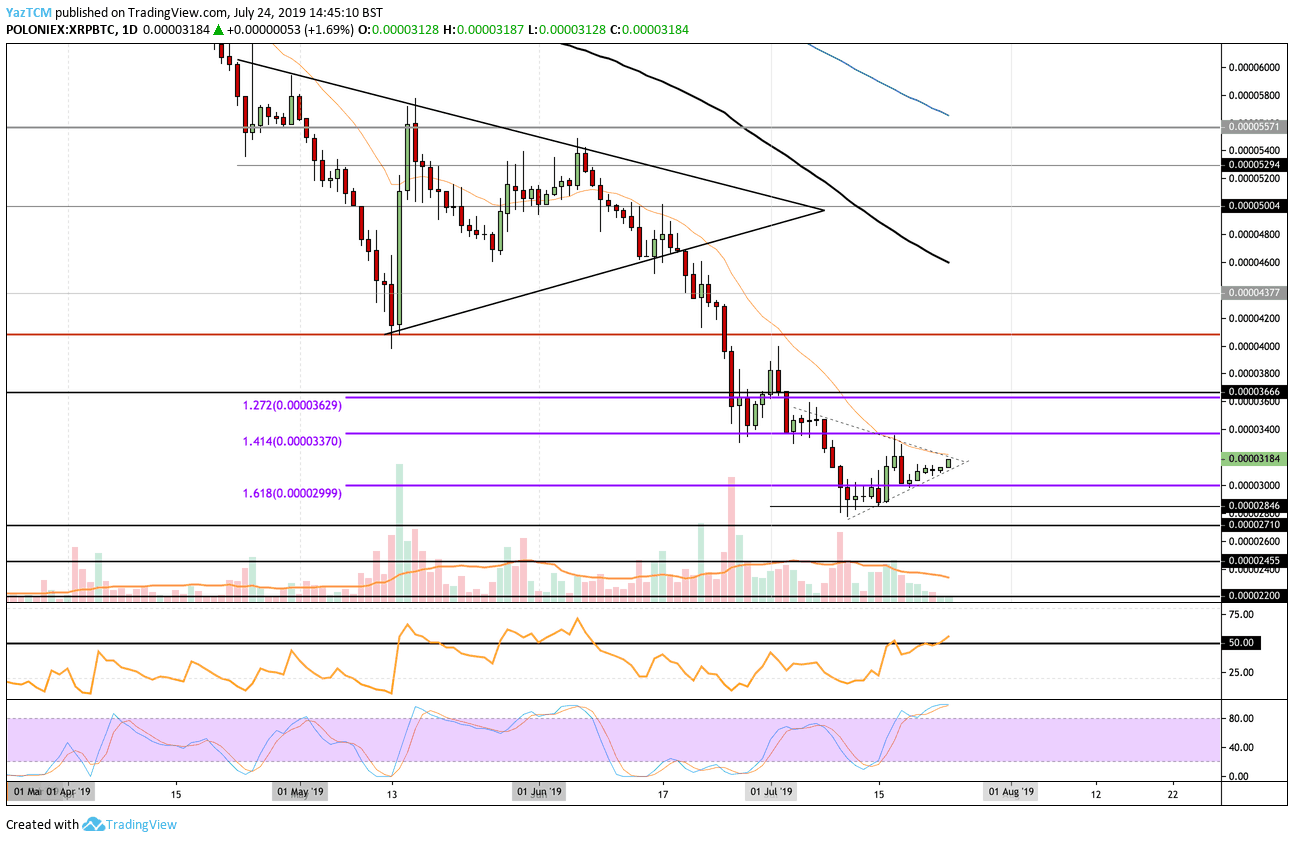
Looking at the XRP/BTC 1-Day Chart:
- Against Bitcoin, we can see that XRP is slowly starting to grind higher. After bottoming out around the 2850 SAT level, XRP has started to slowly ascend as it currently trades at around 3184 SAT. XRP is also contained within a symmetrical triangle as we wait for the bulls to push the market higher, hopefully.
- From above: If the bulls can break above the upper boundary of the triangle we can expect initial resistance to being located at 3370 SAT. Above this, higher resistance lies at 3400 SAT, 3500 SAT, 3629 SAT, 3800 SAT and 4000 SAT.
- From below: If the sellers push the market beneath the lower boundary of the triangle we can expect support at 3000 SAT. Beneath 3000 SAT, further support lies at 2850 SAT, 2600 SAT, 2455 SAT and 2000 SAT.
- The trading volume has also been steadily decreasing this month, which could be a sign that the selling has come to a close.
- The RSI has recently managed to climb above the 50 level which is a promising sign. However, the Stochastic RSI is in overbought conditions and is primed for a bearish crossover signal which would cause the market to drop slightly.
The post Ripple Price Analysis: XRP Continues To Hold At $0.30, Are We Ready For A Move? appeared first on CryptoPotato.