Ripple Price Analysis: XRP Breaks Above 46 Cents, $0.5 Next?
Ripple has seen an interesting 24 hour period as it was able to surge past the resistance at $0.46 – for the first time since early November 2018. The cryptocurrency even touched $0.52 but was unable to sustain as the market retraced to close just beneath $0.48.
Despite the pullback, the recent break above $0.46 is very good news for XRP holders as the cryptocurrency struggled at this level through May and June 2019. Ripple now marks a 22% increase over the past month with a further 55% increase over the past 3 months.
XRP continues to be the third largest cryptocurrency sitting on a market cap of around $20 billion.
Looking at the XRP/USD 1-Day Chart:
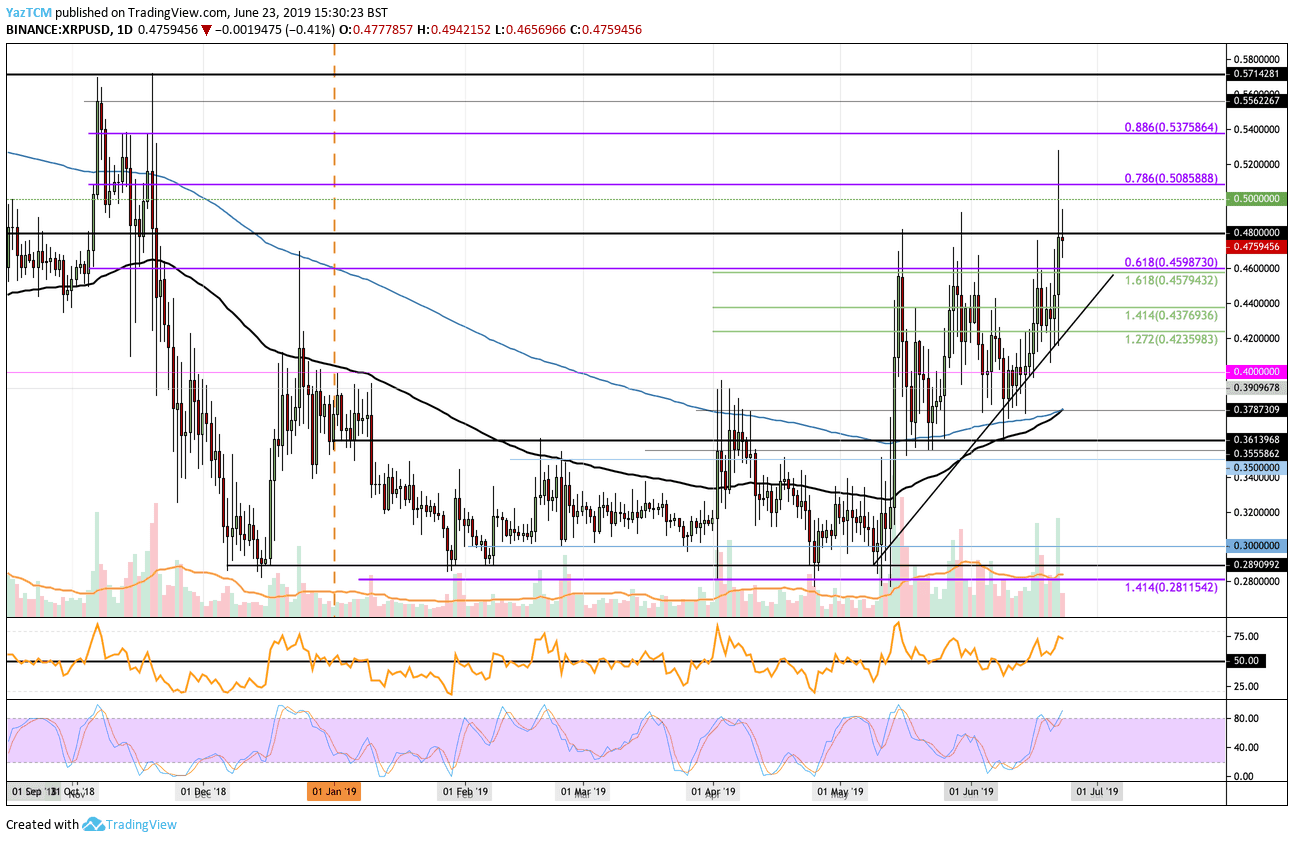
- Since our previous XRP/USD analysis, we can see that Ripple continued to rise slowly, holding the support at the rising trend line that has been established since early May 2019. Yesterday the cryptocurrency was able to break above the resistance at $0.46 and to close even higher at $0.48.
- From above: The nearest level of strong resistance lies at $0.48 and $0.50. If the buyers break above $0.50, higher resistance then lies at $0.5085 (bearish .786 Fib Retracement), $0.52, and $0.5375 (bearish .886 Fib Retracement). If the price goes past $0.54, further resistance is found at $0.5562 and $0.5714 (the November 2018 high).
- From below: The nearest level of strong support is now at $0.46. This level had previously provided strong resistance for the market during May and June and therefore is expected to provide strong support moving forward. Beneath $0.46, further support lies at $0.44, $0.43, $0.4235, $0.40, and $0.39.
- The trading volume has remained very high during both May and June.
- The Stochastic RSI is approaching overbought territory which could be a sign that the market may retrace – however, there is still room for this to happen.
Looking at the XRP/BTC 1-Day Chart:
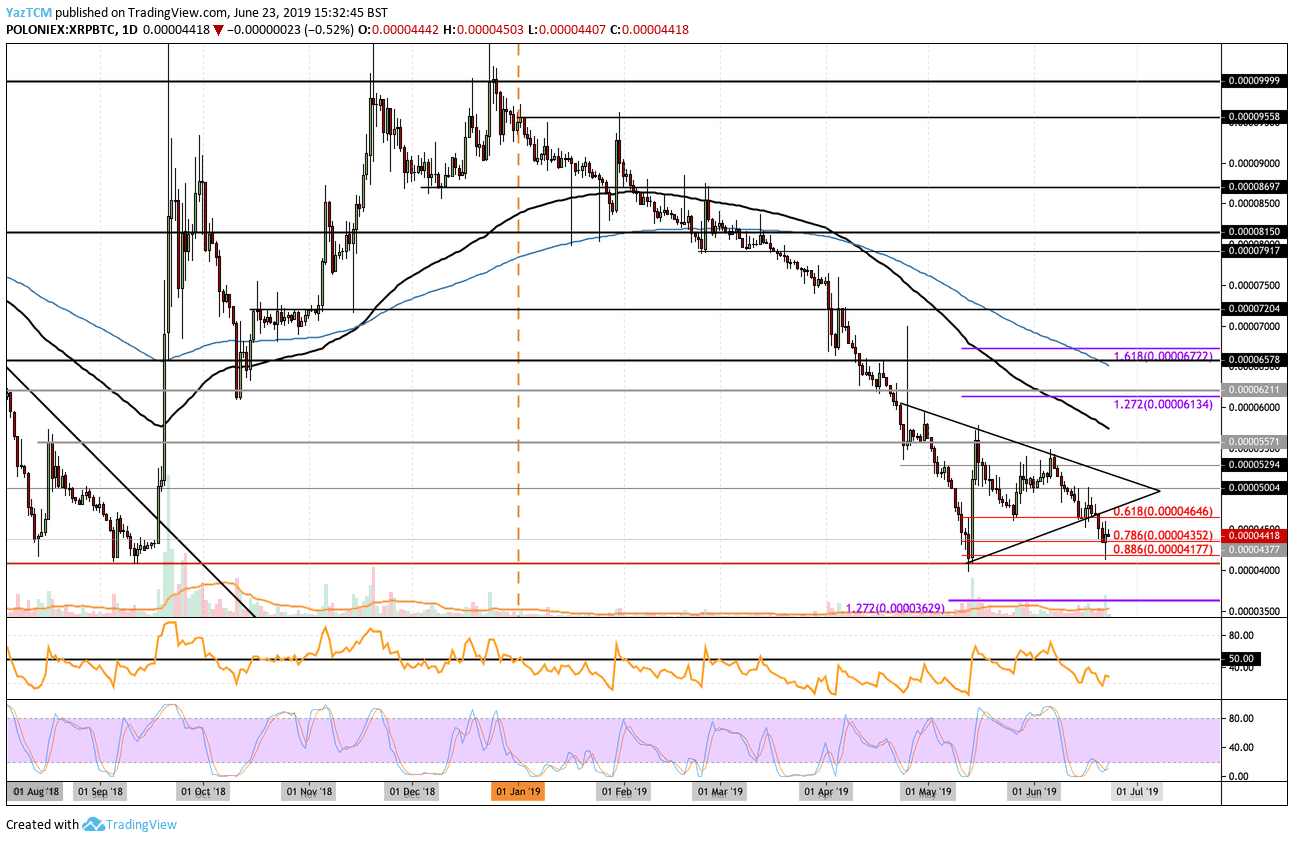
- Against Bitcoin, we can see that XRP has continued to collapse further, dropping beneath the previous symmetrical triangle pattern that was taking shape. We can see that XRP/BTC continued to go lower but it found support at 4350 SAT (.786 Fib Retracement).
- From above: The nearest level of resistance lies at 4500 SAT and 4646 SAT. Above this, we can find more resistance at 5000 SAT, 5300 SAT, 5570 SAT, and 6000 SAT.
- From below: The nearest level of strong support lies at 4352 SAT. Beneath this, further support is found at 4177 SAT and 4000 SAT. The support at 4000 SAT is expected to be strong as it maintained during September 2018 and May 2019.
- The trading volume has remained high and it spiked above the average during the XRP/USD surge yesterday.
- The Stochastic RSI is in oversold conditions which suggest that the sellers are overstretched. However, the Stochastic RSI has been in oversold territory for the entire month as we continue to wait for the bullish crossover signal above.
The post Ripple Price Analysis: XRP Breaks Above 46 Cents, $0.5 Next? appeared first on CryptoPotato.