Ripple Price Analysis: XRP Battling to Remain Above $1 as Bulls Struggle with Momentum
XRP/USD – Bulls Battle To Maintain $1
Key Support Levels: $1.00, $0.9, $0.8282
Key Resistance Levels: $1.05, $1.25, $1.32.
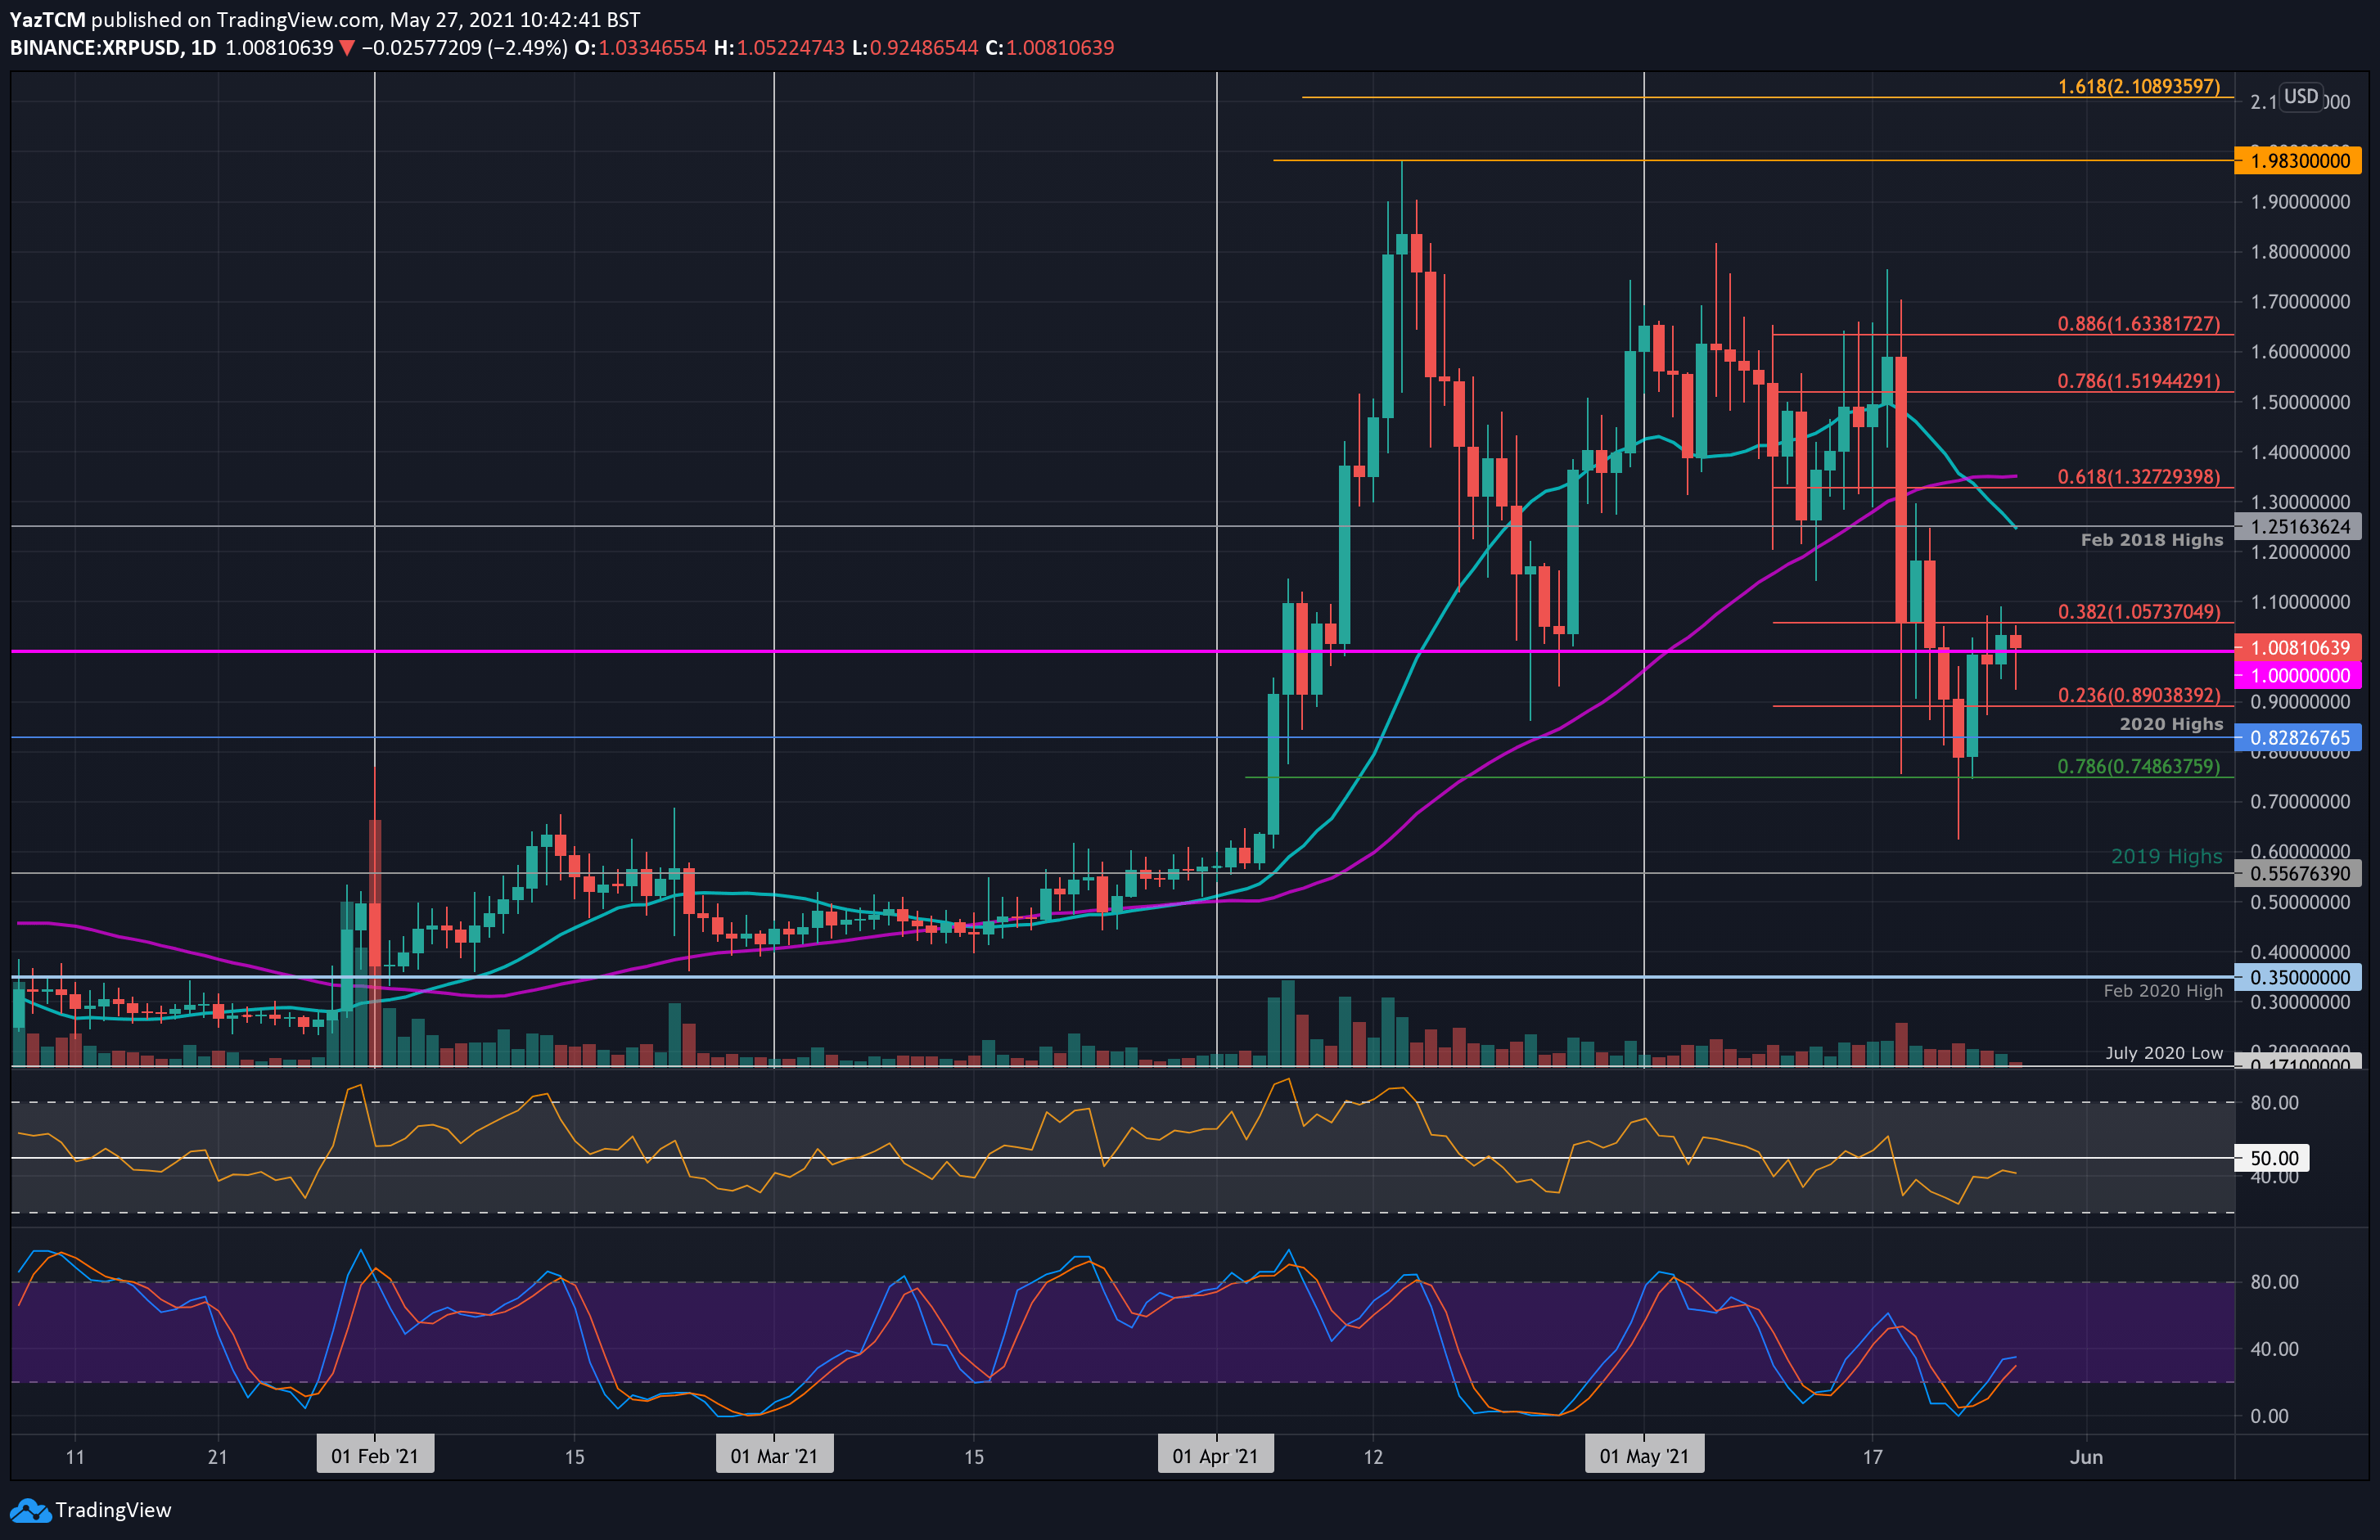
XRP has rebounded by a total of 61% from Sunday’s low, around $0.62 but is struggling to break $1.05. The cryptocurrency closed Sunday’s daily candle at around $0.8 and started to shoot higher on Monday to reach $1.00.
Yesterday, XRP managed to penetrate $1 but failed to overcome resistance at $1.05, provided by a bearish .382 Fib Retracement. Today, XRP spiked as low as $0.93 and is battling to maintain the support at $1.
XRP-USD Short Term Price Prediction
Looking ahead, the first resistance lies at $1.05 (bearish .382 Fib). This is followed by $1.25 (Feb 2018 highs & 20-day MA), $1.32 (bearish .618 Fib & 50-day MA), and $1.50 (bearish .786 Fib).
On the other side, the first support lies at $1.00. Beneath this, support lies at $0.90, $0.8282 (2020 Highs), and $0.75 (.786 Fib).
The RSI is recovering from oversold conditions but is failing to get anywhere near the midline. This indicates that, although the extreme bearish pressure is decreasing, the buyers are still unable to take control of the market momentum.
XRP/BTC – Bulls Make An Attempt To Close Above 50-day MA
Key Support Levels: 2400 SAT, 2260 SAT, 2000 SAT.
Key Resistance Levels: 2662 SAT, 2800 SAT, 3000 SAT.
XRP found support at 2260 SAT (.786 Fib) against bitcoin over the weekend. It did spike as low as 2000 SAT but the buyers recovered by the end of the day to close above the aforementioned support.
Since then, the bulls have pushed XRP higher to climb above the 50-day MA at around 2500 SAT. However, they seem to be struggling to overcome resistance at 2662 SAT, provided by a bearish .382 Fib.

XRP-BTC Short Term Price Prediction
Looking ahead, the first resistance lies at 2662 SAT (bearish .382 Fib). This is followed by 2800 SAT (20-day MA), 2865 SAT (bearish .5 Fbi), and 3000 SAT (bearish .618 Fib).
On the other side, the first level of support lies at 2400 SAT. This is followed by 2260 SAT (.786 Fib), 2000 SAT, and $1900 SAT (July 2020 low).
Likewise, the RSI is struggling to make any ground above the midline, indicating that the bulls are still not ready to take over the market momentum just yet. To break beyond 3000 SAT, the RSI would need to break the midline to show that the buyers are in control of the market.

