Ripple Price Analysis: XRP Against a Critical Resistance Following 22% Weekly Gains
XRP/USD – XRP Struggles With 200-day MA Resistance
Key Support Levels: $0.71, $0.667, $0.638.
Key Resistance Levels: $0.781, $0.828, $0.89.
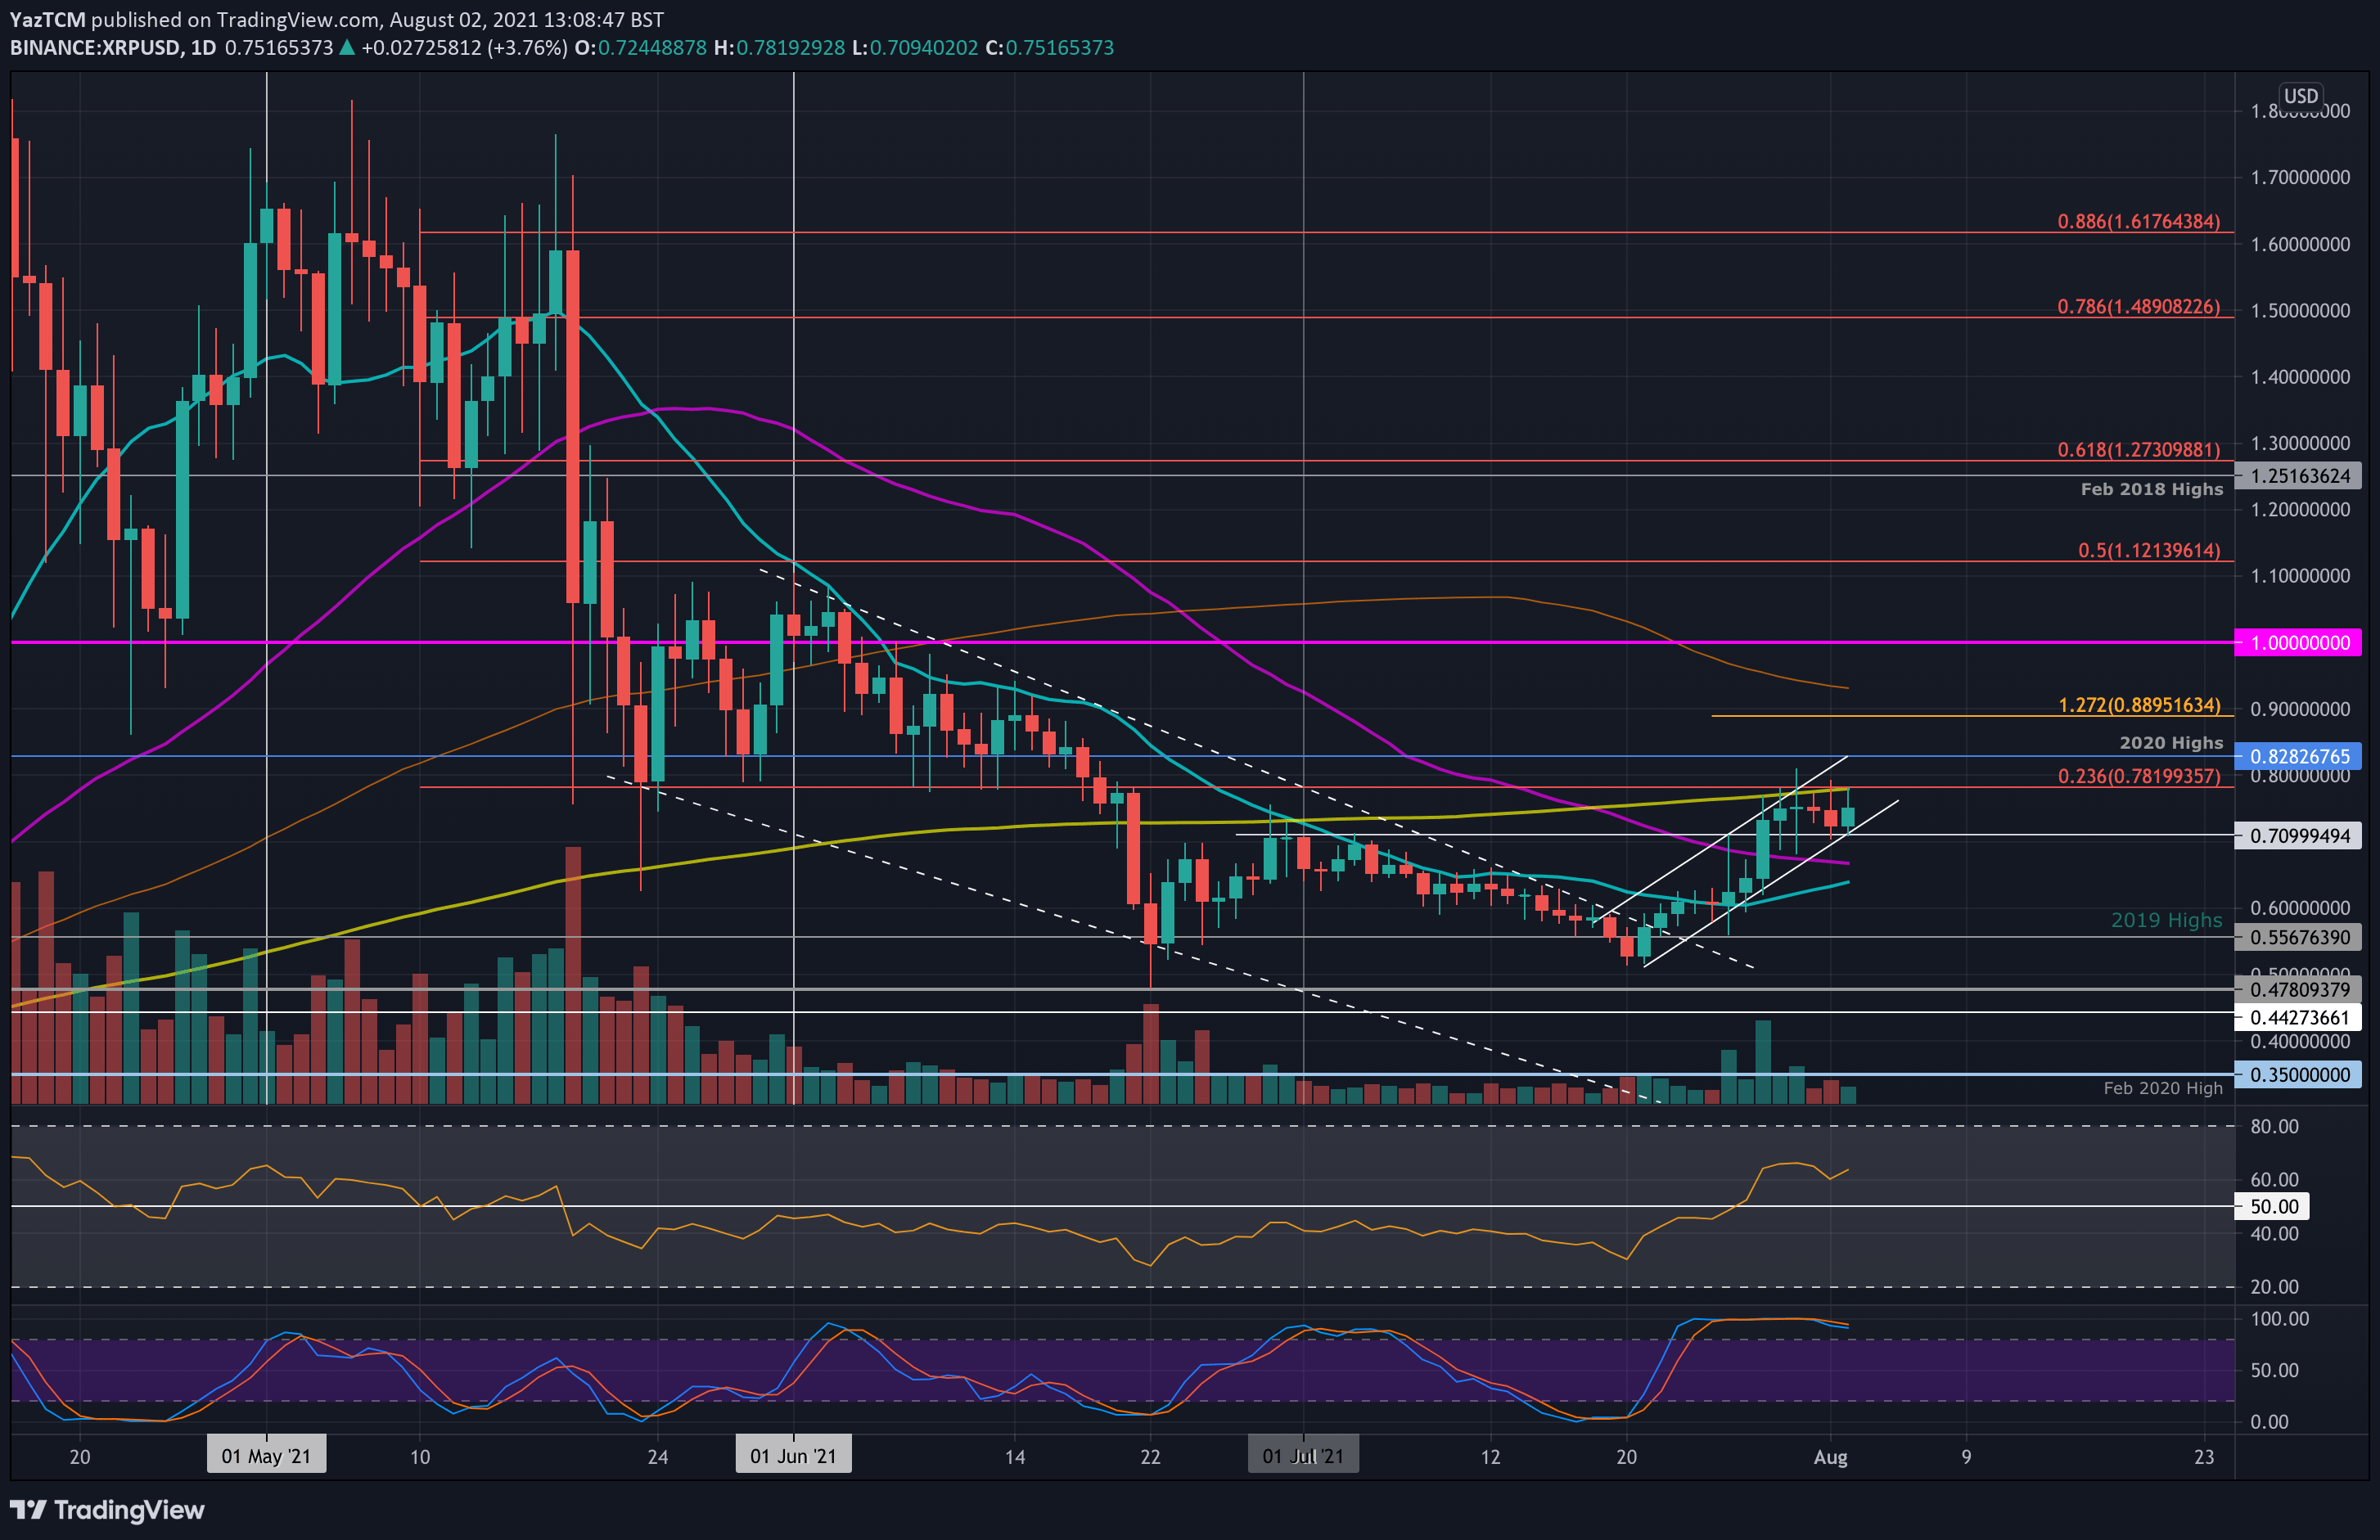
This week’s 21.5% surge for XRP saw the coin climb above the 20-day MA around $0.6 to reach the current $0.74 level. It broke above a descending wedge formation over the past fortnight and started to surge inside an ascending price channel.
The price channel allowed XRP to break the 50-day MA last week, but the coin is now struggling to overcome the 200-day MA at around $0.781. In addition, there is a bearish .236 Fib that also bolsters the resistance here. The market has been rejected five times at the 200-day MA, but the lower boundary of the price channel continues to provide support.
XRP-USD Short Term Price Prediction
Looking ahead, the first resistance lies at $0.781 (200-day MA & bearish .236 Fib). This is followed by $0.828 (2020 highs), $0.89 (1.272 Fib Extension), $0.94 (100-day MA), and $1.
On the other side, the first support lies at $0.71 (lower angle of price channel). This is followed by $0.667 (50-day MA), $0.638 (20-day MA), and $0.6.
The daily RSI is in bullish territory and points upward, indicating that the buying momentum is increasing.
XRP/BTC – Bulls Fail At 50-day MA
Key Support Levels: 1800 SAT, 1750 SAT, 1660 SAT.
Key Resistance Levels: 1900 SAT, 2000 SAT, 2122 SAT.
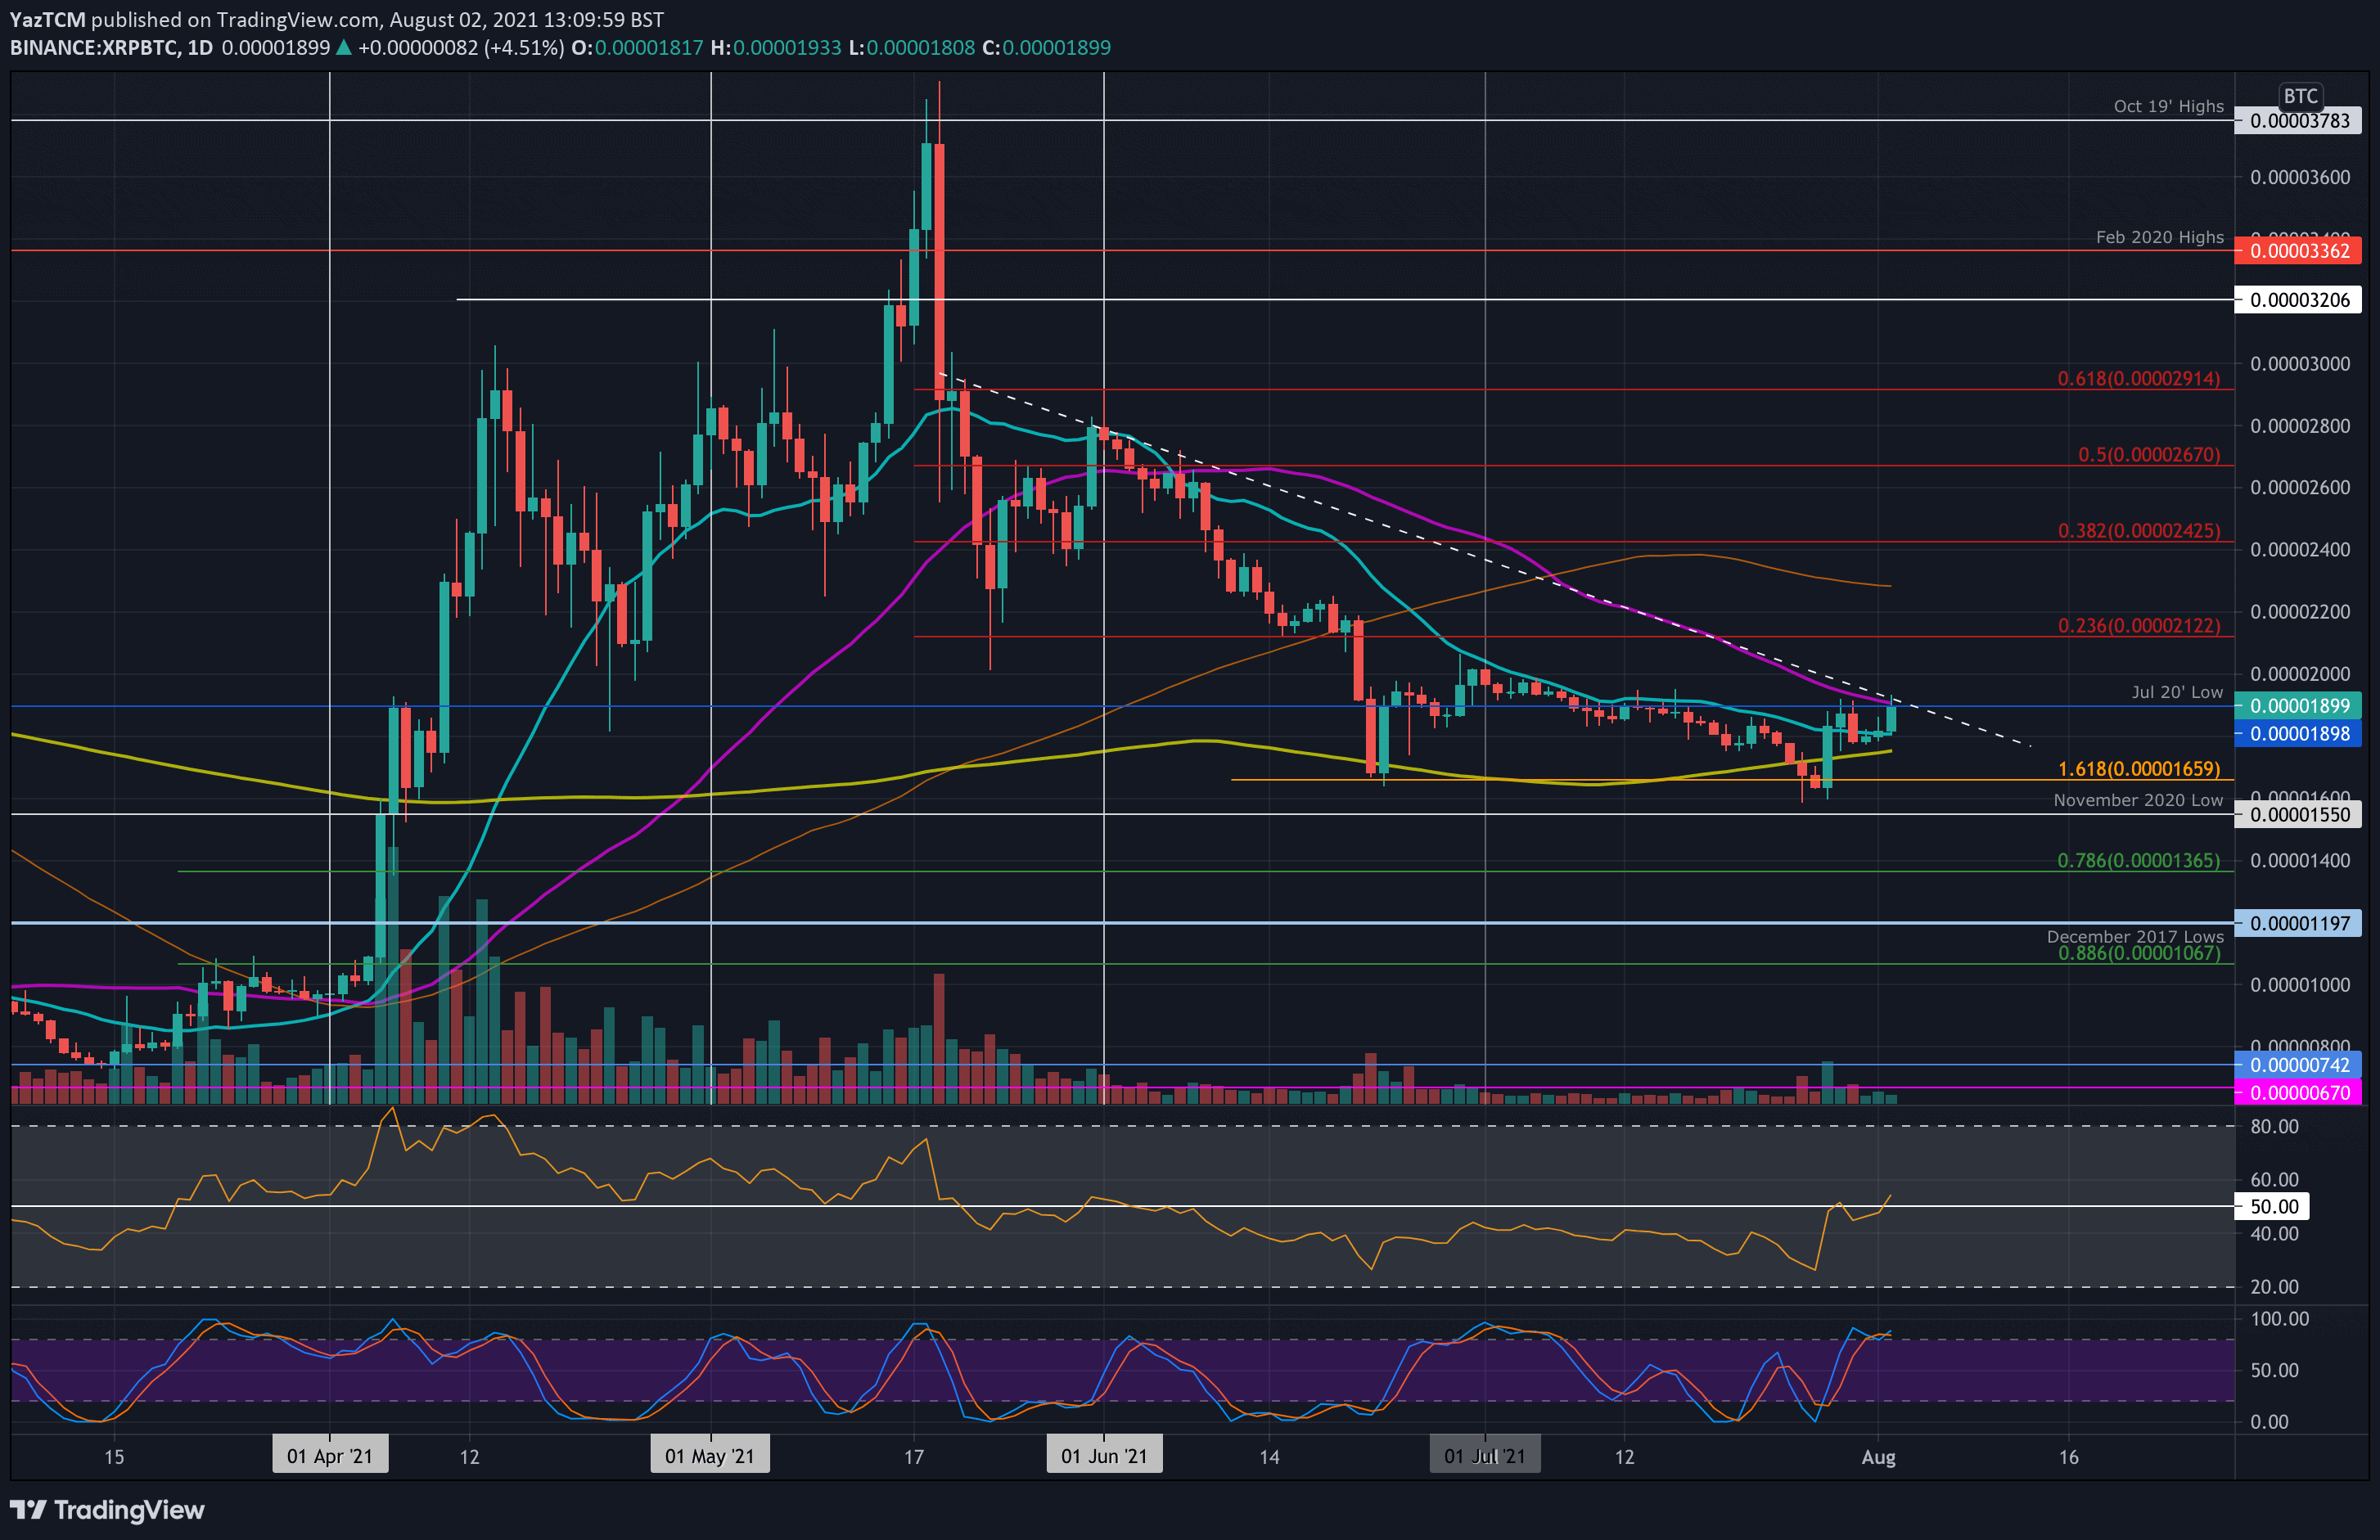
Against BTC, XRP is also performing well as it sits above the 20-day MA at 1800 SAT. However, the coin is struggling to break resistance at 1800 SAT, provided by a 50-day MA. The level there is also further bolstered by a long-term descending trend line and the fact that it is the July 2020 lows.
The coin still has strong support below, but the combined resistance at 1900 AST would need to be overcome before XRP can attempt the July highs around 2000 SAT.
XRP-BTC Short Term Price Prediction
Looking ahead, the first resistance lies at 1900 SAT (July 2020 low, 50-day MA, & falling trend line). This is followed by 2000 SAT, 2122 SAT (bearish .236 Fib), and 2290 SAT (100-day MA).
On the other side, the first support lies at 1800 SAT (20-day MA). This is followed by 1750 SAT (200-day MA), 1660 SAT (June support), and 1550 SAT (Nov 2020 low).
The RSI here is just about pushing above the midline and is the highest level since mid-May. If the momentum can continue upward, XRP should have no trouble overcoming the current resistance.

