Ripple Price Analysis: Where Is XRP Headed After a 20% Monthly Decline?
Ripple has been trading within a tight range between the 100-day moving average and the crucial $1.9 support level.
Further consolidation within this range is expected until a decisive breakout occurs, determining the next major price movement.
XRP Analysis
By Shayan
The Daily Chart
Over the past few months, XRP has remained inside an expanding wedge pattern, with the $1.9 support level acting as a strong defense for buyers. This critical price zone aligns with the 0.5 Fibonacci retracement level, making it a significant area of interest. Meanwhile, the asset faces major resistance at the 100-day moving average of $2.5, a level likely filled with supply.
As a result, Ripple continues to trade in a narrow range near the wedge’s lower boundary, suggesting that consolidation will persist in the short term. However, if the price maintains support at this level, an eventual breakout to the upside could spark a fresh rally.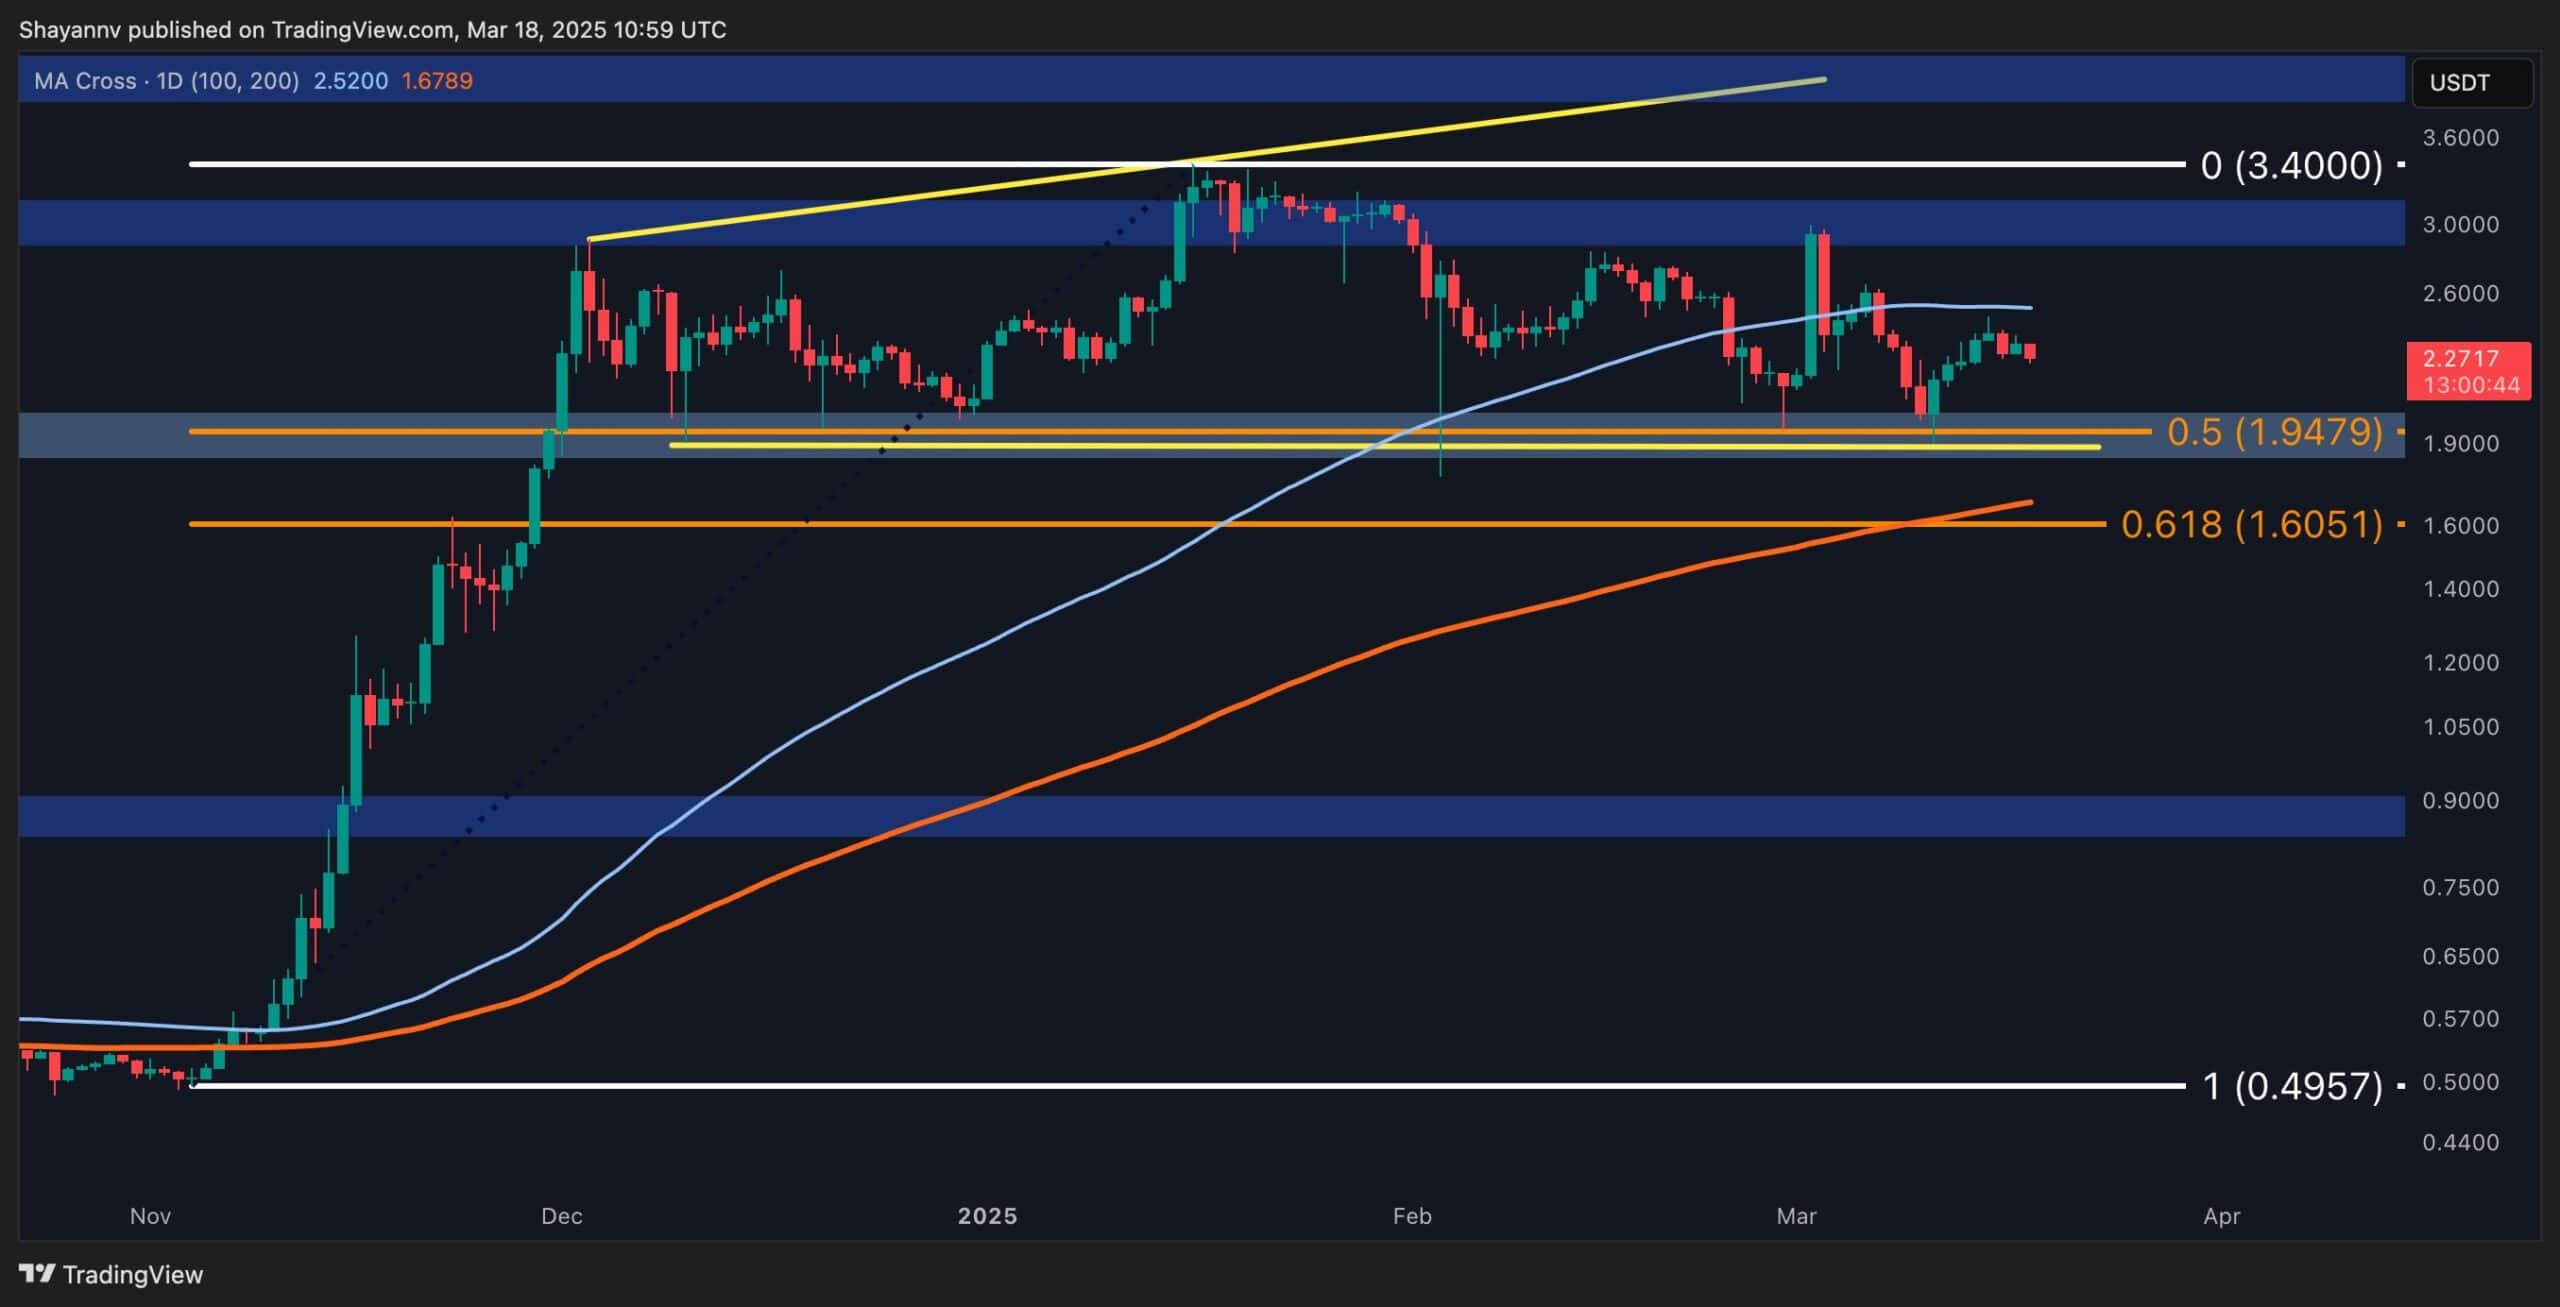
The 4-Hour Chart
On the 4-hour timeframe, XRP has been forming a bullish flag pattern, recently finding support at its lower boundary around $1.9. Given this structure, slight bullish retracements toward the pattern’s upper boundary are likely in the short term.
This price action suggests ongoing liquidity hunts and market cooling, potentially allowing smart money to accumulate positions. If a rebound occurs at this crucial level, a retest of the $2.8 resistance level could follow, signaling a potential continuation of the broader bullish trend.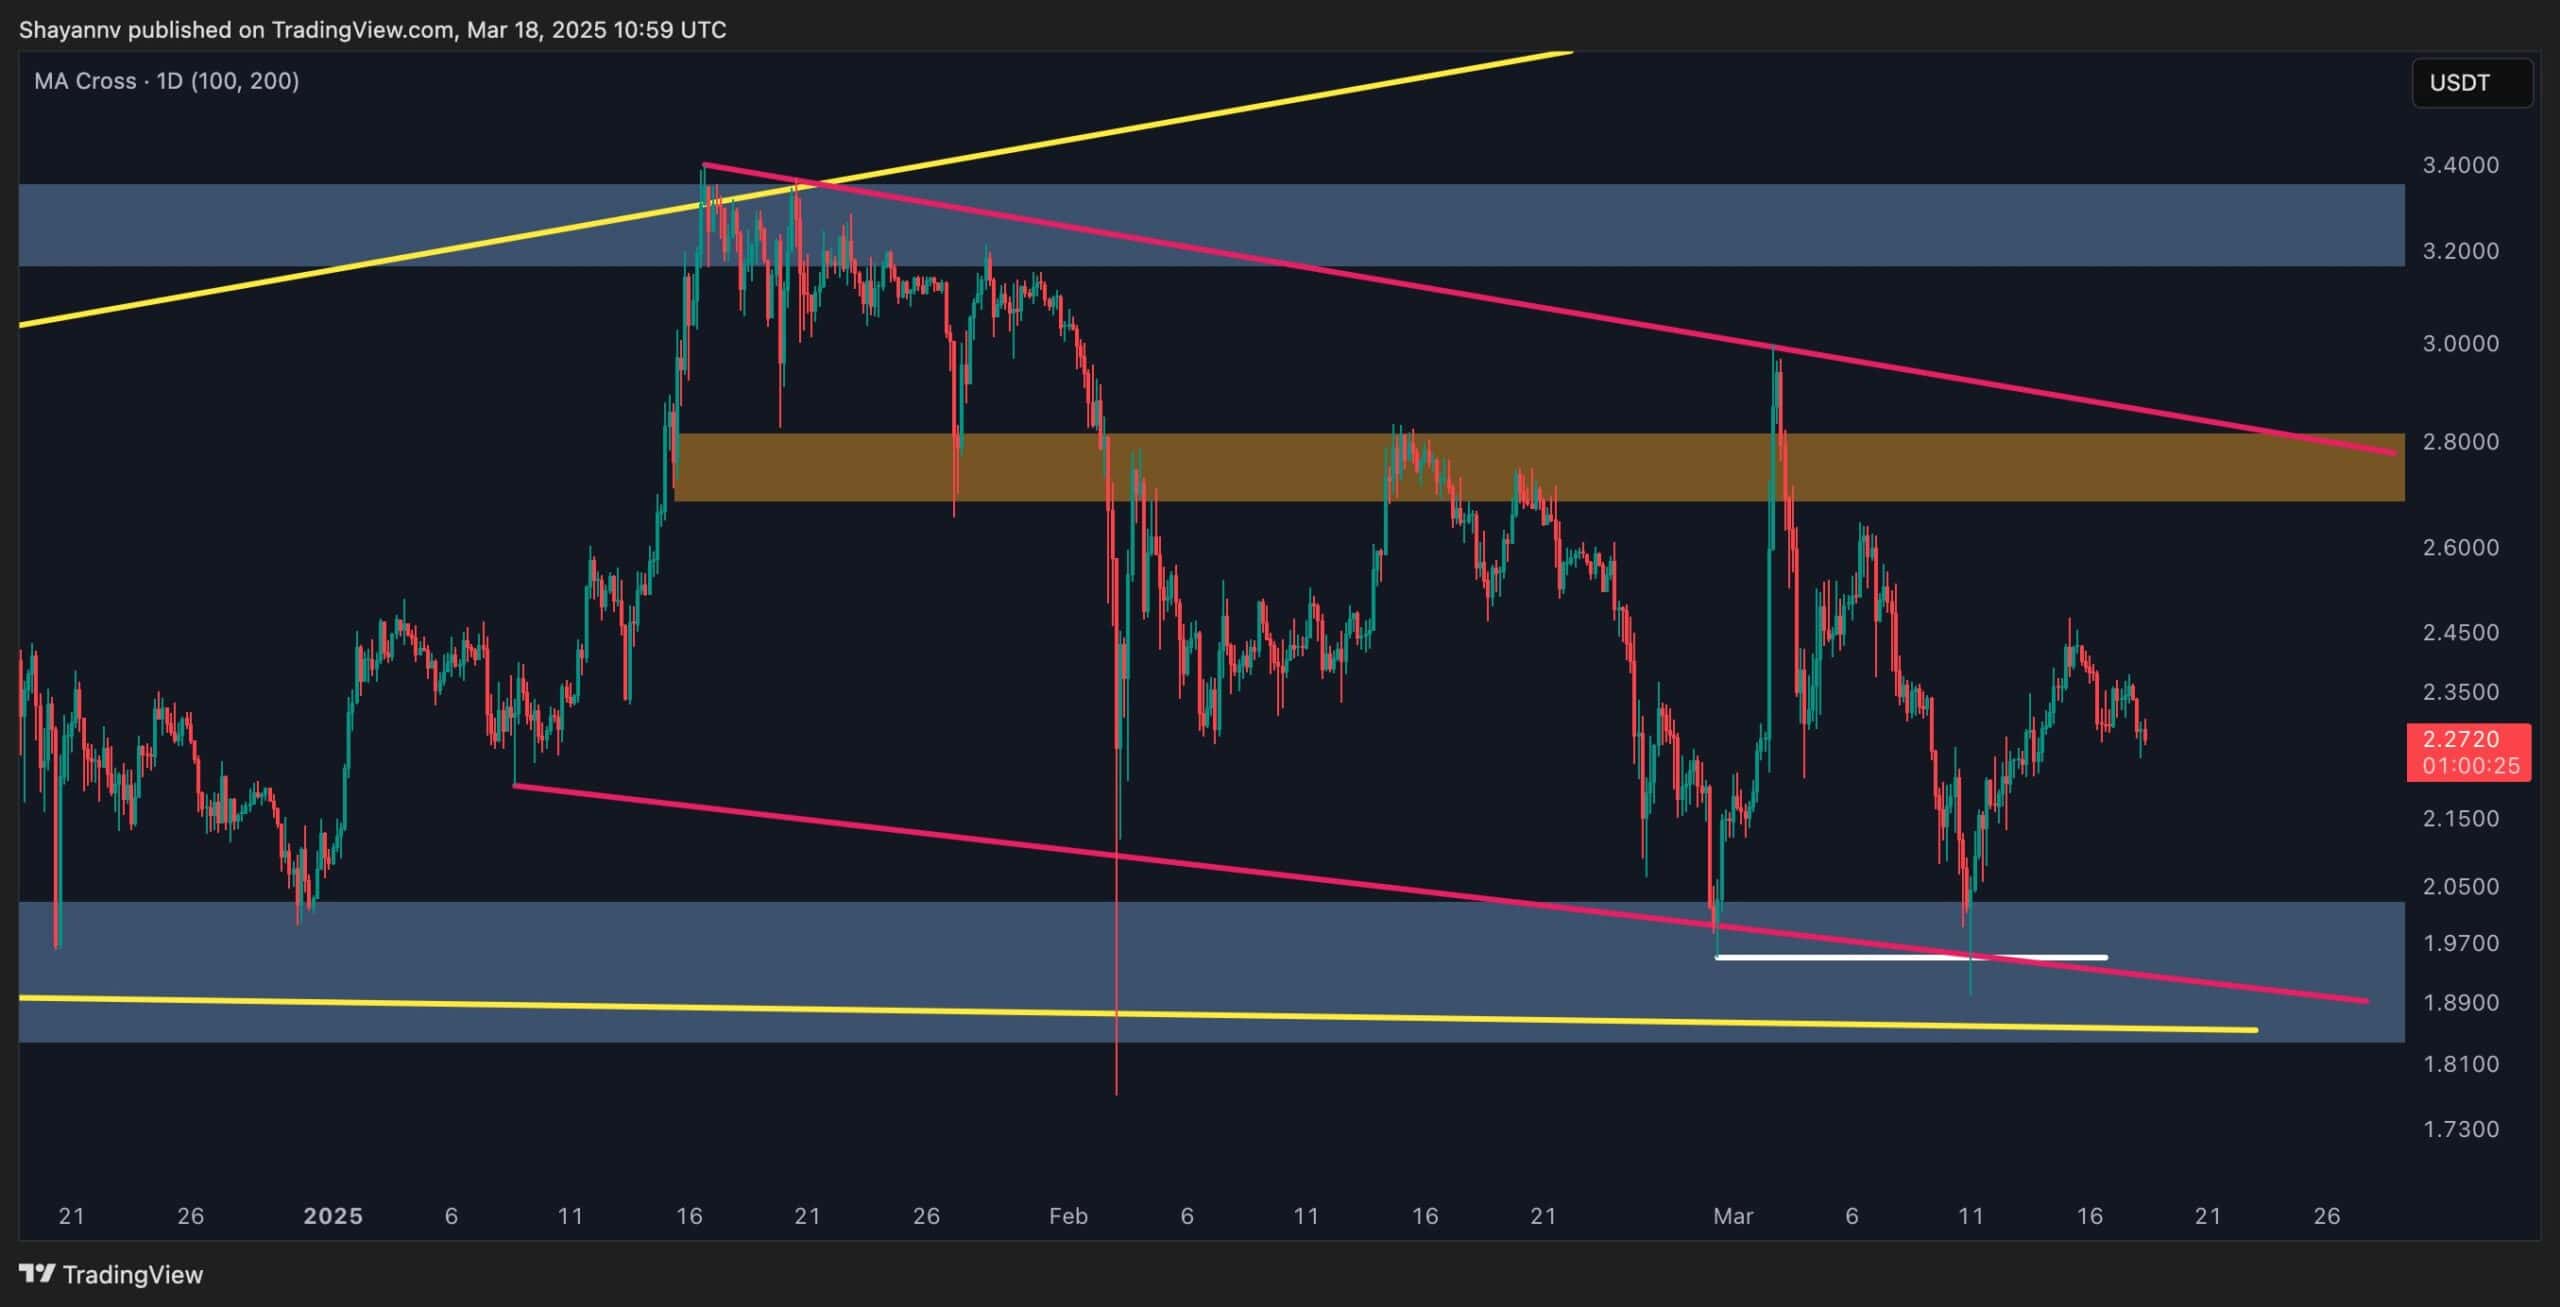
The post Ripple Price Analysis: Where Is XRP Headed After a 20% Monthly Decline? appeared first on CryptoPotato.