Ripple Price Analysis: What’s Next for XRP Following the Recent 17% Crash?
The recent XRP rally has been nothing short of remarkable. The asset broke through major resistance levels and gained significant momentum.
However, with current indicators reflecting signs of overextension, a short-term correction or consolidation phase appears to be on the horizon.
XRP Price Analysis
By Shayan
The Weekly Chart
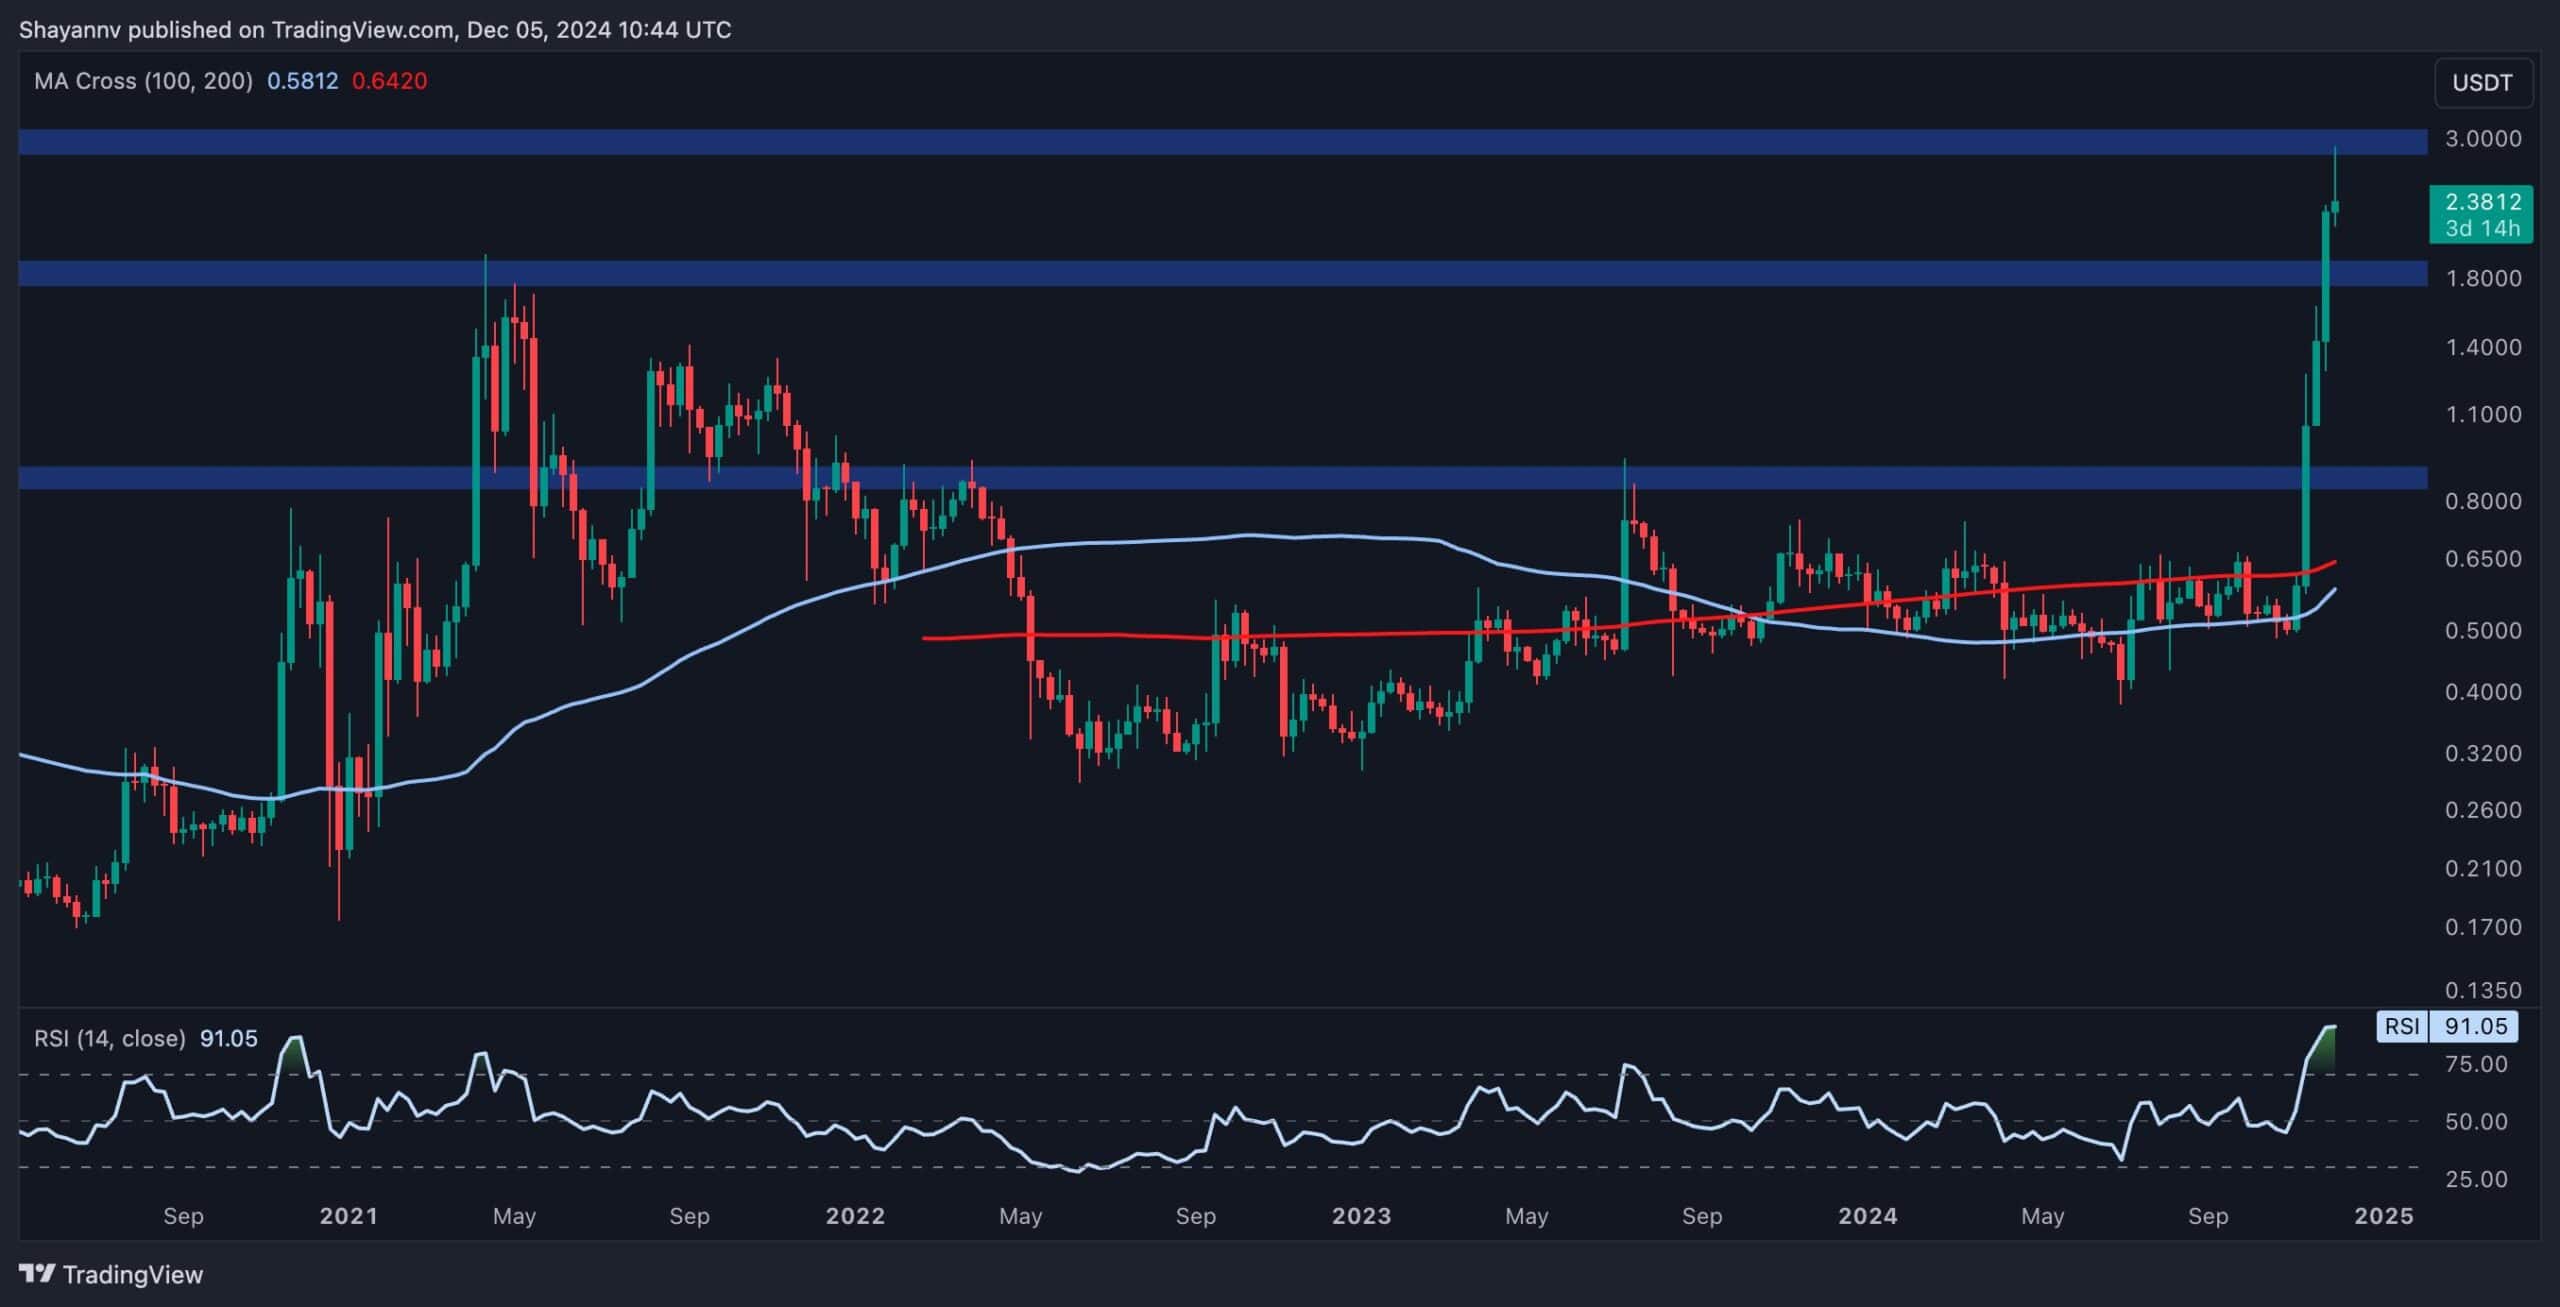
XRP has staged an impressive breakout, rallying nearly 300% in recent weeks. The price has exceeded the $2 resistance and moved toward the $3 psychological level.
This bullish momentum has been fueled by substantial buying pressure, as indicated by the decisive move above the 100—and 200-week moving averages.
Notably, the RSI (Relative Strength Index) has soared into overbought territory, reaching a level of 91, which is extremely rare and indicative of overheated conditions.
Historically, such extreme RSI levels often precede periods of consolidation or corrective retracements. From a structural perspective, the $1.80-$2 range now serves as critical support, and a pullback to these levels would represent a healthy correction for the continuation of the broader uptrend.
The 4-Hour Chart
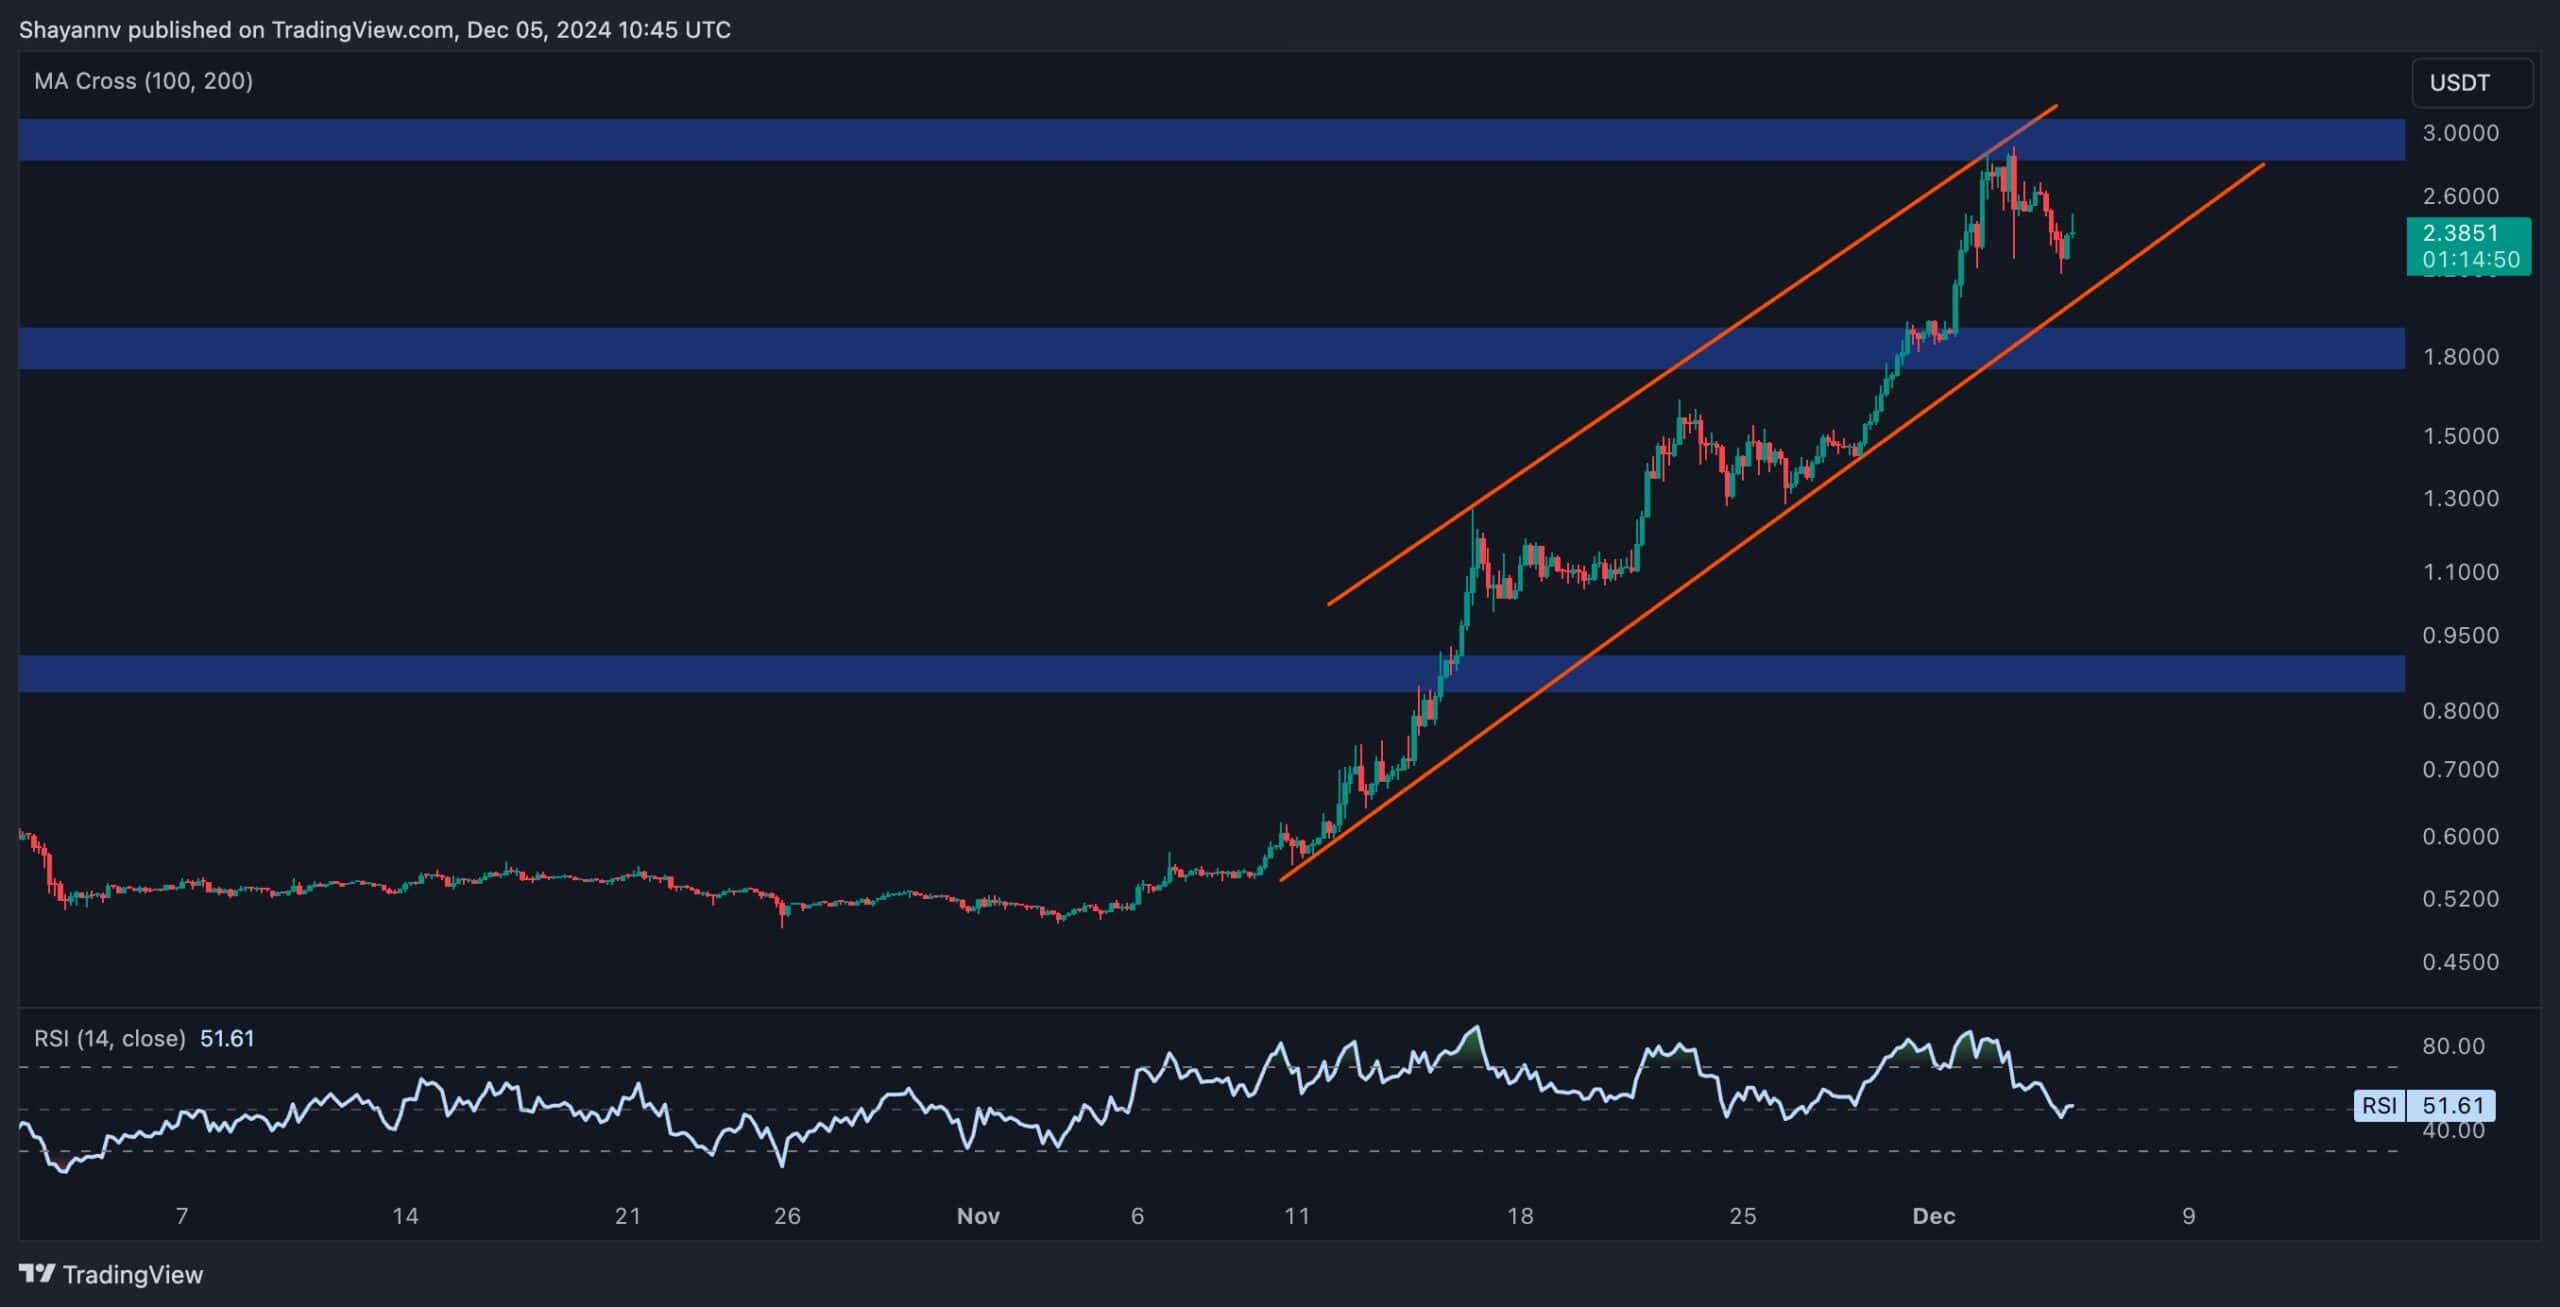
On the 4-hour chart, XRP maintained a strong bullish structure, consistently setting higher highs and lows within an ascending channel. The recent breakout above $2.5 highlights buyers’ dominance, though the price briefly retreated after encountering resistance near $3.
Interestingly, the RSI in this timeframe has shown a significant bearish divergence, suggesting waning momentum.
This, coupled with the increasingly crowded long positions in the futures market, raises the likelihood of short-term corrective action. A pullback toward the $2.40-$2.50 region, aligning with the lower boundary of the ascending channel, could provide a fresh entry point for bulls.
In summary, while Ripple’s mid-term outlook remains overwhelmingly bullish, the market will likely experience short-term consolidation or a minor correction. This would be a welcome development, allowing for healthier and more sustainable growth in the weeks ahead.
The post Ripple Price Analysis: What’s Next for XRP Following the Recent 17% Crash? appeared first on CryptoPotato.

