Ripple Price Analysis: This is The XRP’s Next Target If Bearish Sentiment Continues
The bears managed to push XRP’s price below the key support at $0.33 after a month of a sideways trend. This level has been crucial in maintaining Ripple’s price since mid-2019.
Technical Analysis
Technical Analysis By Grizzly
The Daily Chart
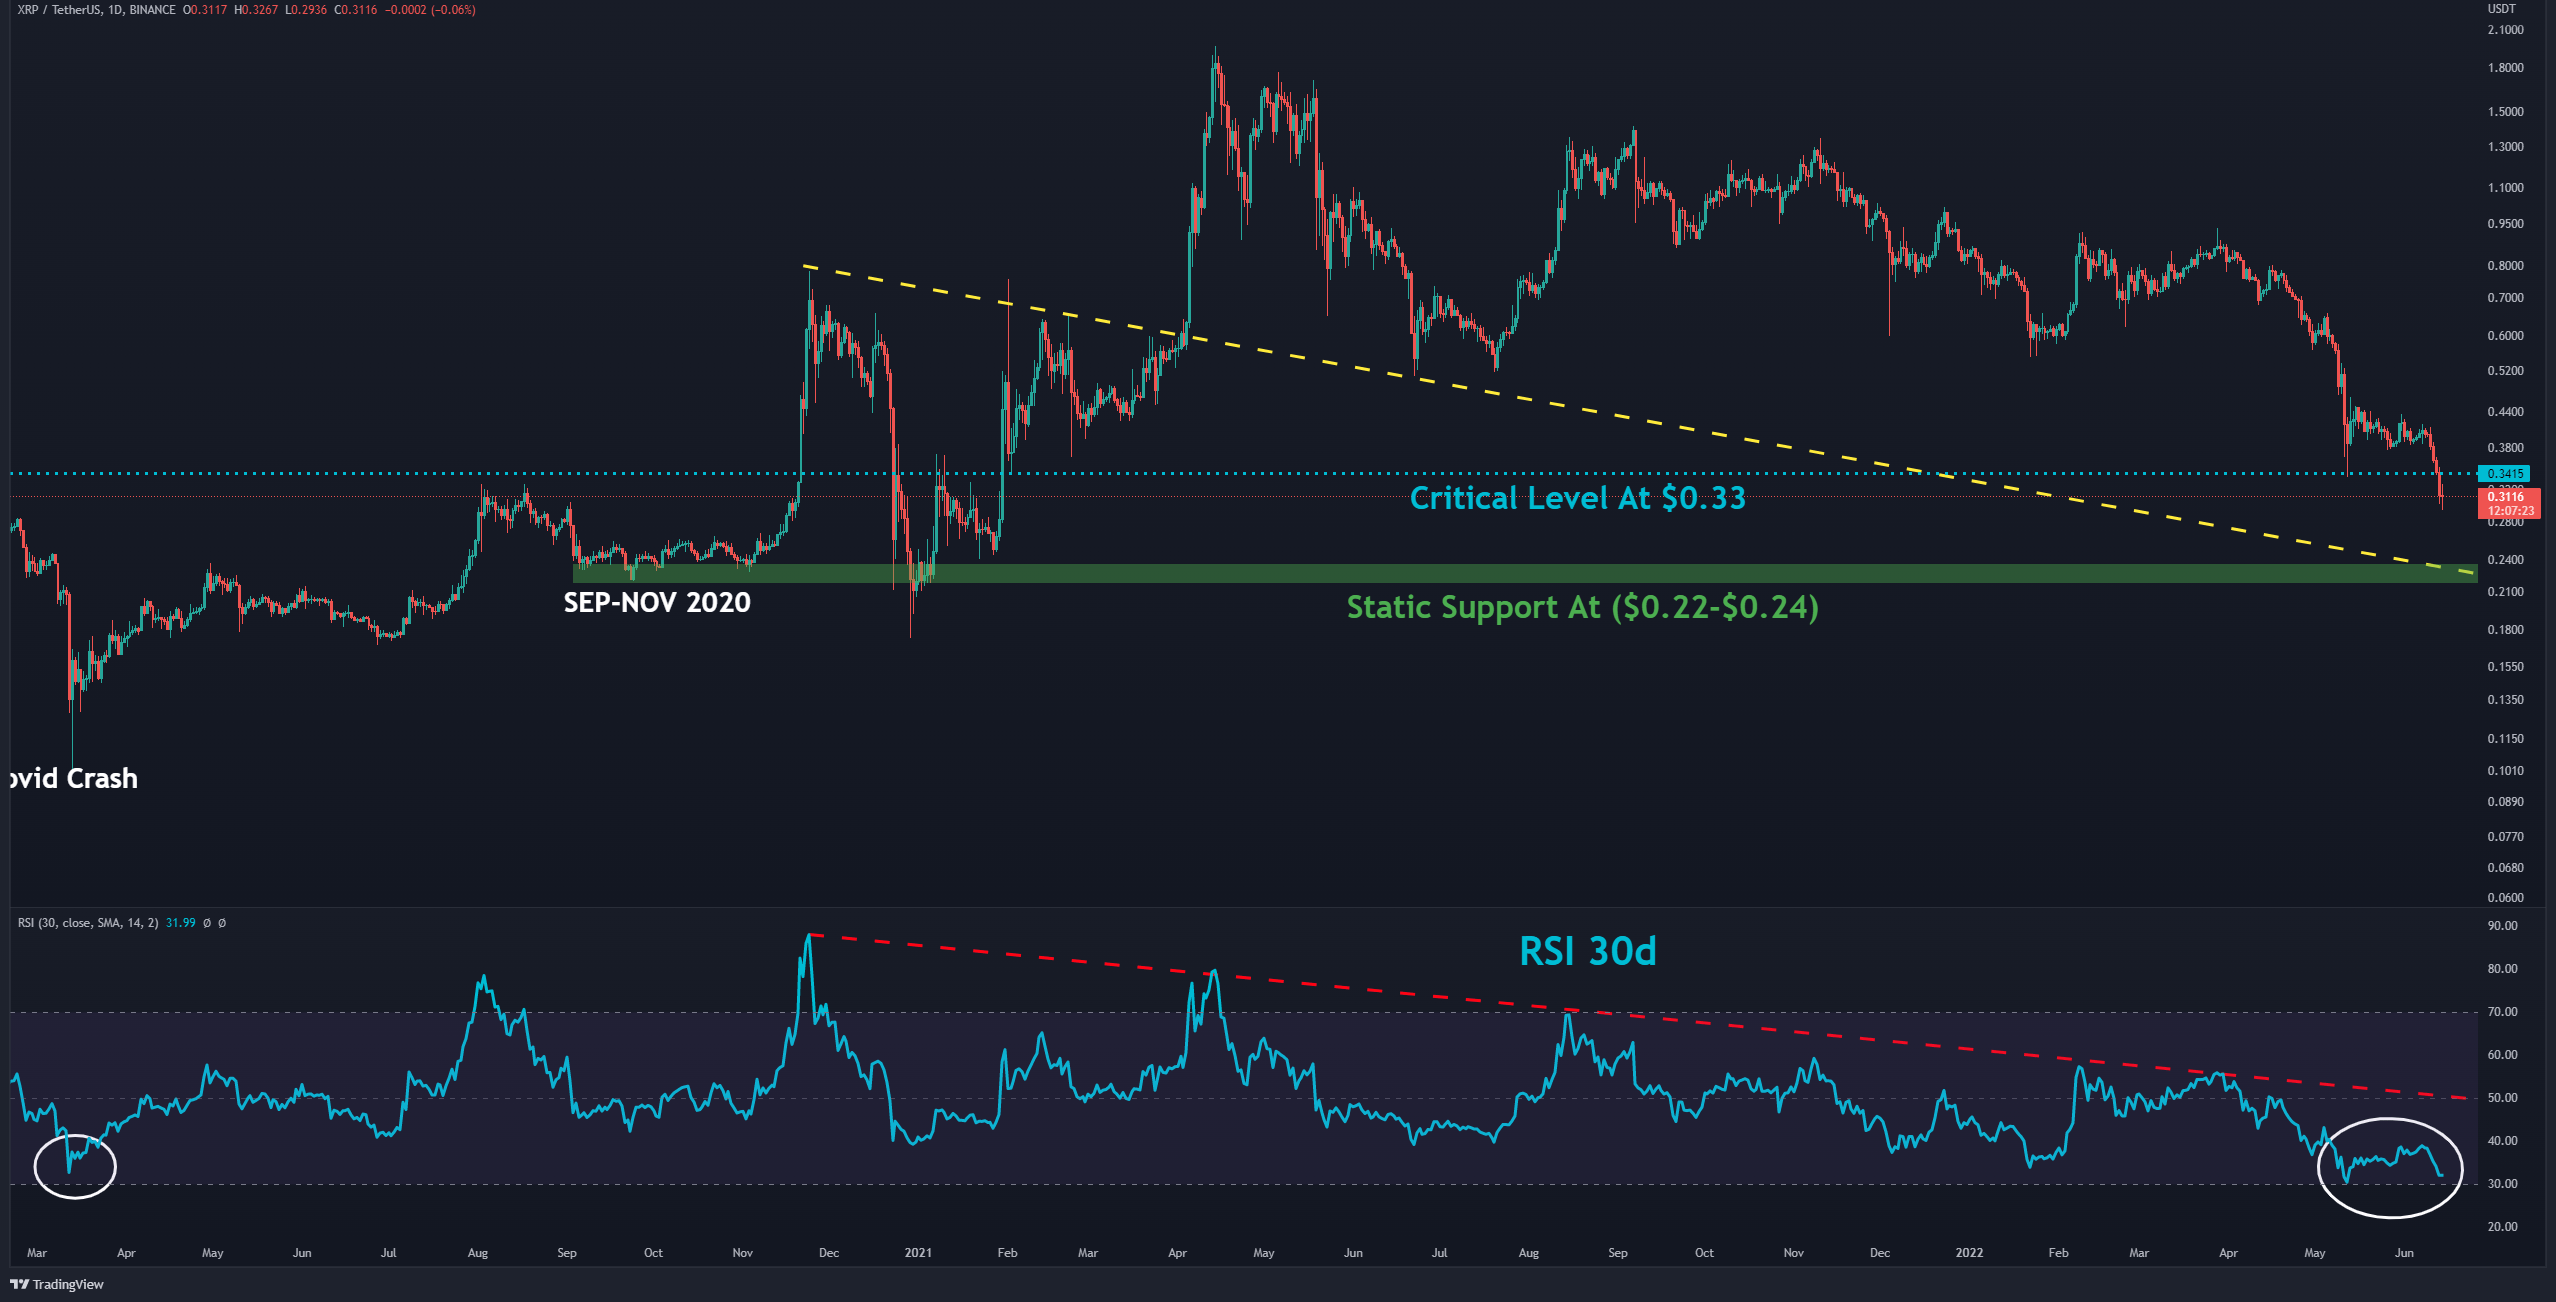
On the daily timeframe, Ripple has lost about 28% of its value in the past seven days. By the time of this writing, the daily candle indicates that the bearish momentum is probably slightly weakened. But that’s not necessarily because a bullish reversal is nearby.
In the bearish case, Ripple will likely slide down to the intersection between the dynamic support (marked yellow) and the horizontal support (marked green) at $0.24. This level has not been tested since late 2020 and early 2021, and it should be considered a strong PRZ (potential reversal zone).
On the other hand, a bullish reversal scenario will be confirmed in case of consolidation above the resistance at $0.5. The mission seems complicated.
In addition, RSI 30-day indicator has reached its lowest level since the COVID crash of March 2020. The descending line (marked red) is the dynamic resistance Ripple must break to confirm a short-term reversal.
Key Support Levels: $0.24 & $0.17
Key Resistance Levels: $0.33 & $0.46
Moving Averages:
MA20: $0.38
MA50: $0.45
MA100: $0.62
MA200: $0.70
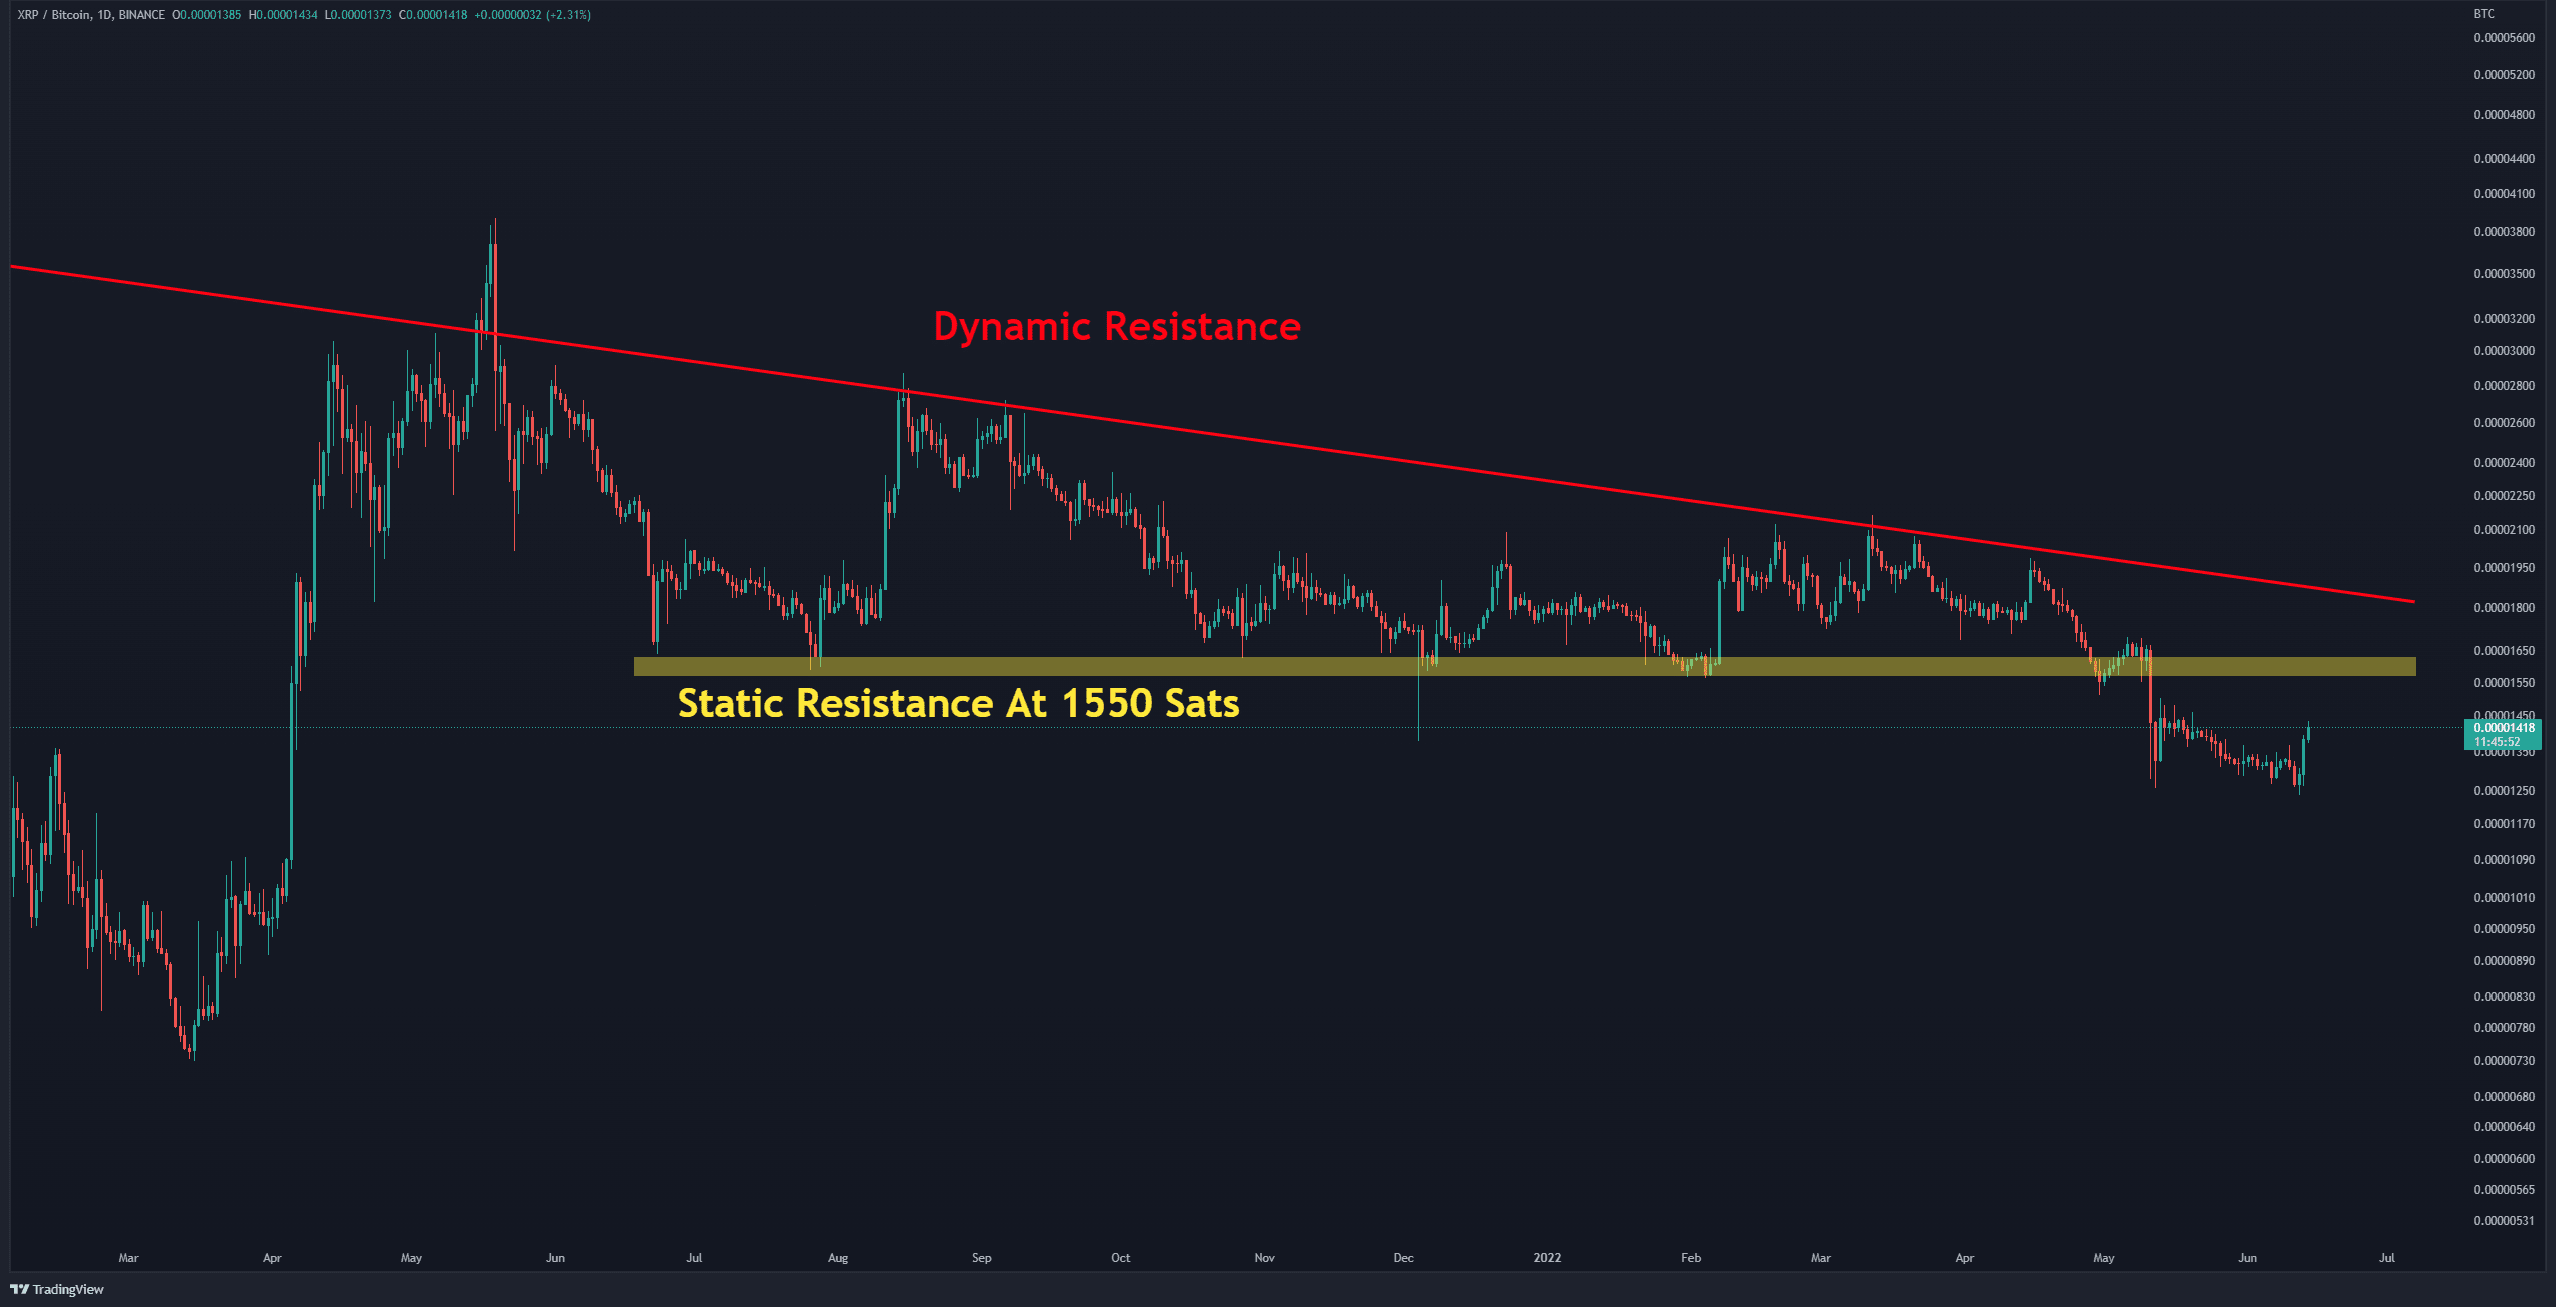
The XRP/BTC Chart
In the BTC pair chart, XRP has increased 14% against Bitcoin in the last three days. However, this should be taken with a grain of salt unless XRP can consolidate on top of the static resistance at 1500 Sats (marked yellow).
In this case, an uptrend can be considered a pullback to retest support turned resistance levels.
Key Support Levels: 1250 Sats & 1100 Sats
Key Resistance Levels: 1550 Sats & 1700 Sats