Ripple Price Analysis June.13: XRP Breaks Above $0.40 Facing Critical Resistance
Ripple (XRP) has seen a small price increase of around 1.12% over the past 24 hours, allowing the price to break back above the $0.40 level. However, the coin has now reached the resistance at the upper boundary of a symmetrical triangle pattern and looks like it may struggle to get above.
It remains ranked in 3rd place amongst the top cryptocurrencies as it currently holds a $17.06 billion market cap. XRP has now seen a promising bullish increase of 25% over the past 30 days which suggests we may see more bullish action on the horizon.
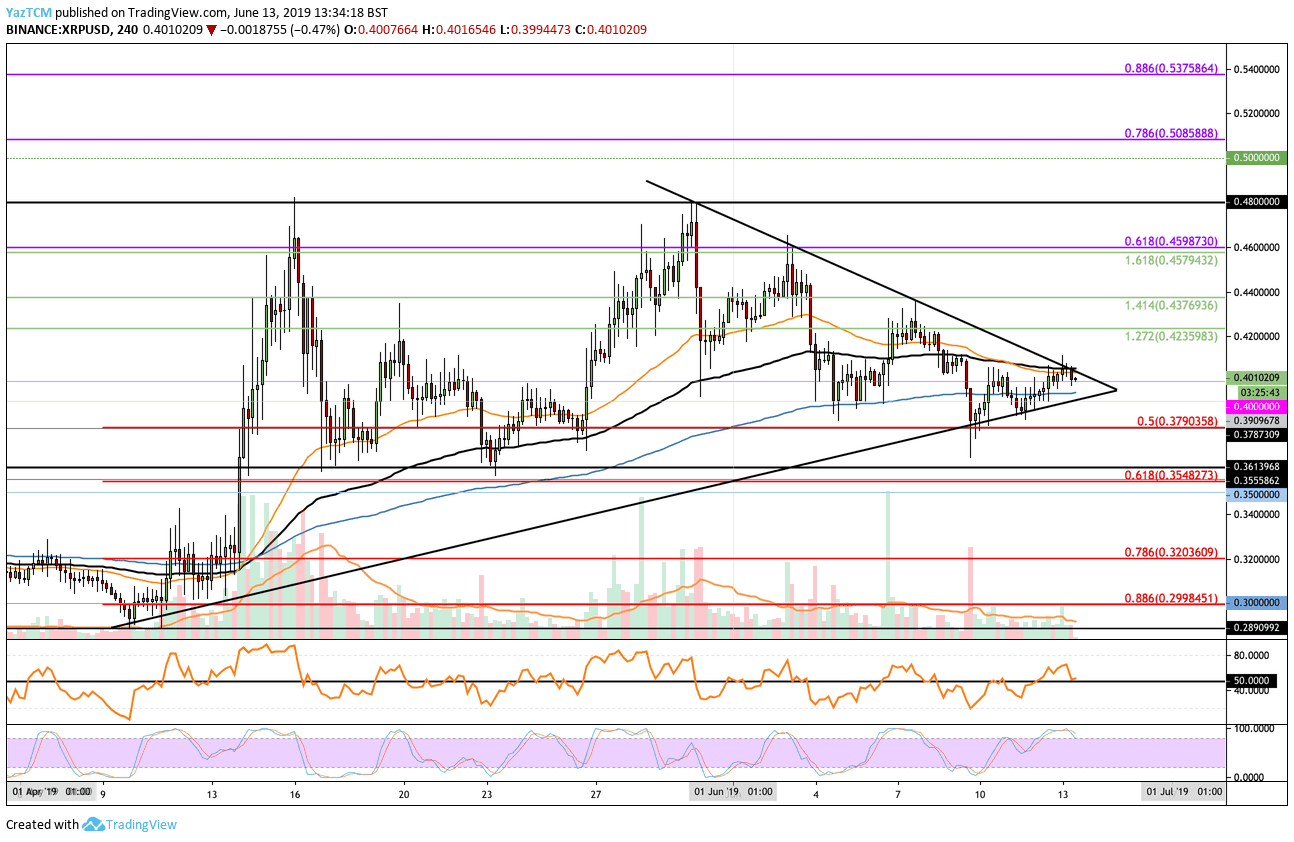
Looking at the XRP/USD 4-HR Chart:
- Since our last XRP/USD analysis, we can see that XRP has rebounded from our previously highlighted support at $0.3790 and has continued higher above $0.40. However, XRP/USD is now trading at the upper boundary of a consolidation pattern.
- From above: If the bulls can push the market above the upper boundary, we can expect immediate higher resistance above to be located at $0.42 and $0.4380. Above this, further resistance is then located at $0.46 – the June 2019 high. If the bulls continue above $0.46, resistance lies at $0.48 and $0.50.
- From below: The nearest level of support now lies at $0.3906. Beneath this, further support lies at the lower boundary of the triangle. If the sellers break beneath, support is then located at $0.3790, $0.3610 and $0.35.
- The trading volume remains pretty lackluster and below the average.
- The Stochastic RSI is in overbought conditions on the 4HR chart which suggests that XRP may break beneath the triangle.
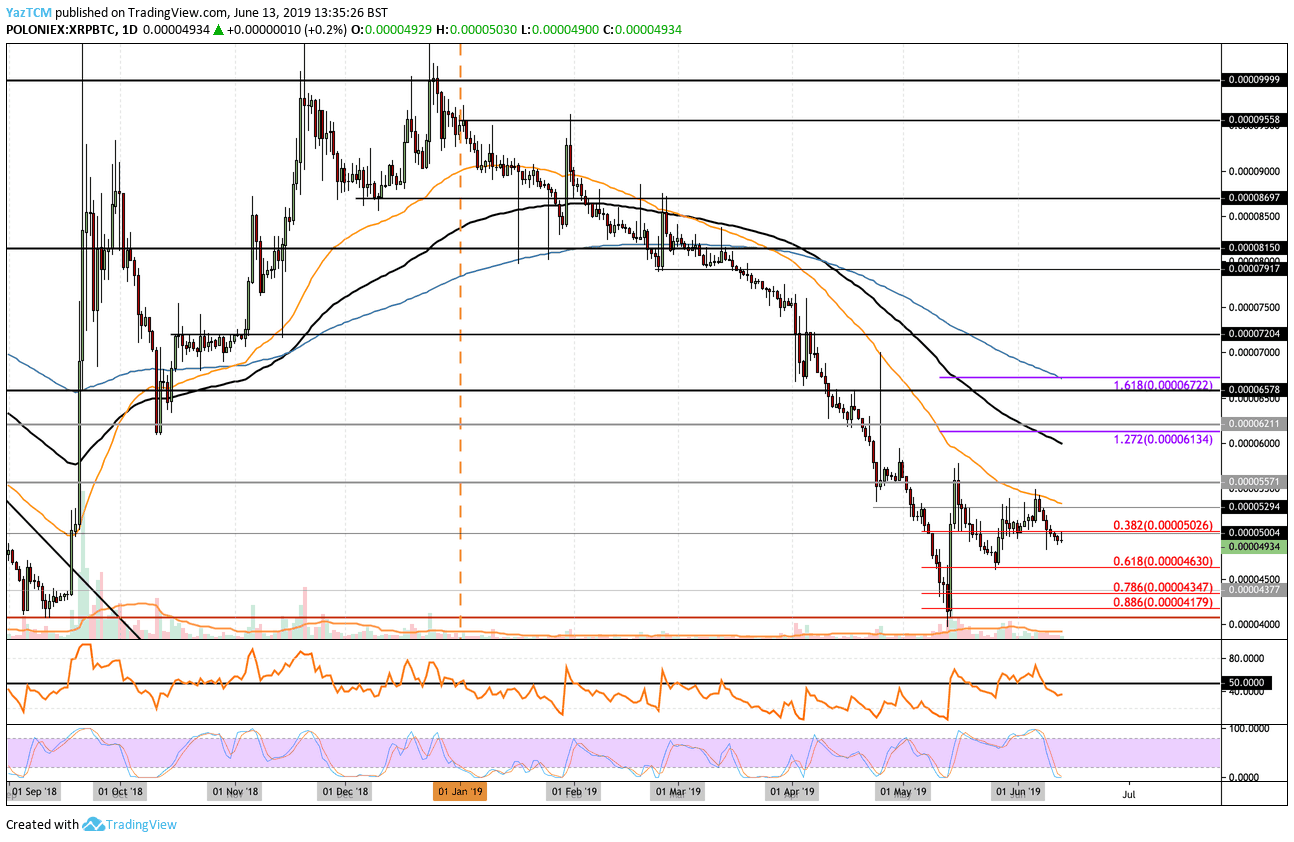
Looking at the XRP/BTC 1-Day Chart:
- Against Bitcoin, We can see that XRP has been struggling to hold grounds above 5000 SAT as it currently trades at around 4934 SAT.
- From above: The nearest level of resistance lies at 5000 SAT. Above this, higher resistance is located at 5300 SAT, 5580 SAT and 6000 SAT. If the buyers push XRP/BTC above 6000 SAT, higher resistance is located at 6135 SAT, 6200 SAT, and 6500 SAT.
- From below: The nearest level of support now lies at 4900 SAT. Beneath this, we can expect lower support at 4630 SAT, 4500 SAT, and 4350 SAT.
- The trading volume in XRP/BTC remains about average.
- The Stochastic RSI has recently dropped to extreme oversold conditions on the daily chart which suggests that a bullish rebound above 5000 SAT is imminent.
The post Ripple Price Analysis June.13: XRP Breaks Above $0.40 Facing Critical Resistance appeared first on CryptoPotato.