Ripple Price Analysis Jan.24: Waiting For The Next Move
Not much has changed since our last post. However, according to the chart’s structure, it looks as though a breakout can be expected to take place very soon.
BTC is still holding the support level of the 0.618-0.764 Fibonacci retracement level and above the horizontal support level of (from Daily chart) at the $3,600-$3,400 price level.
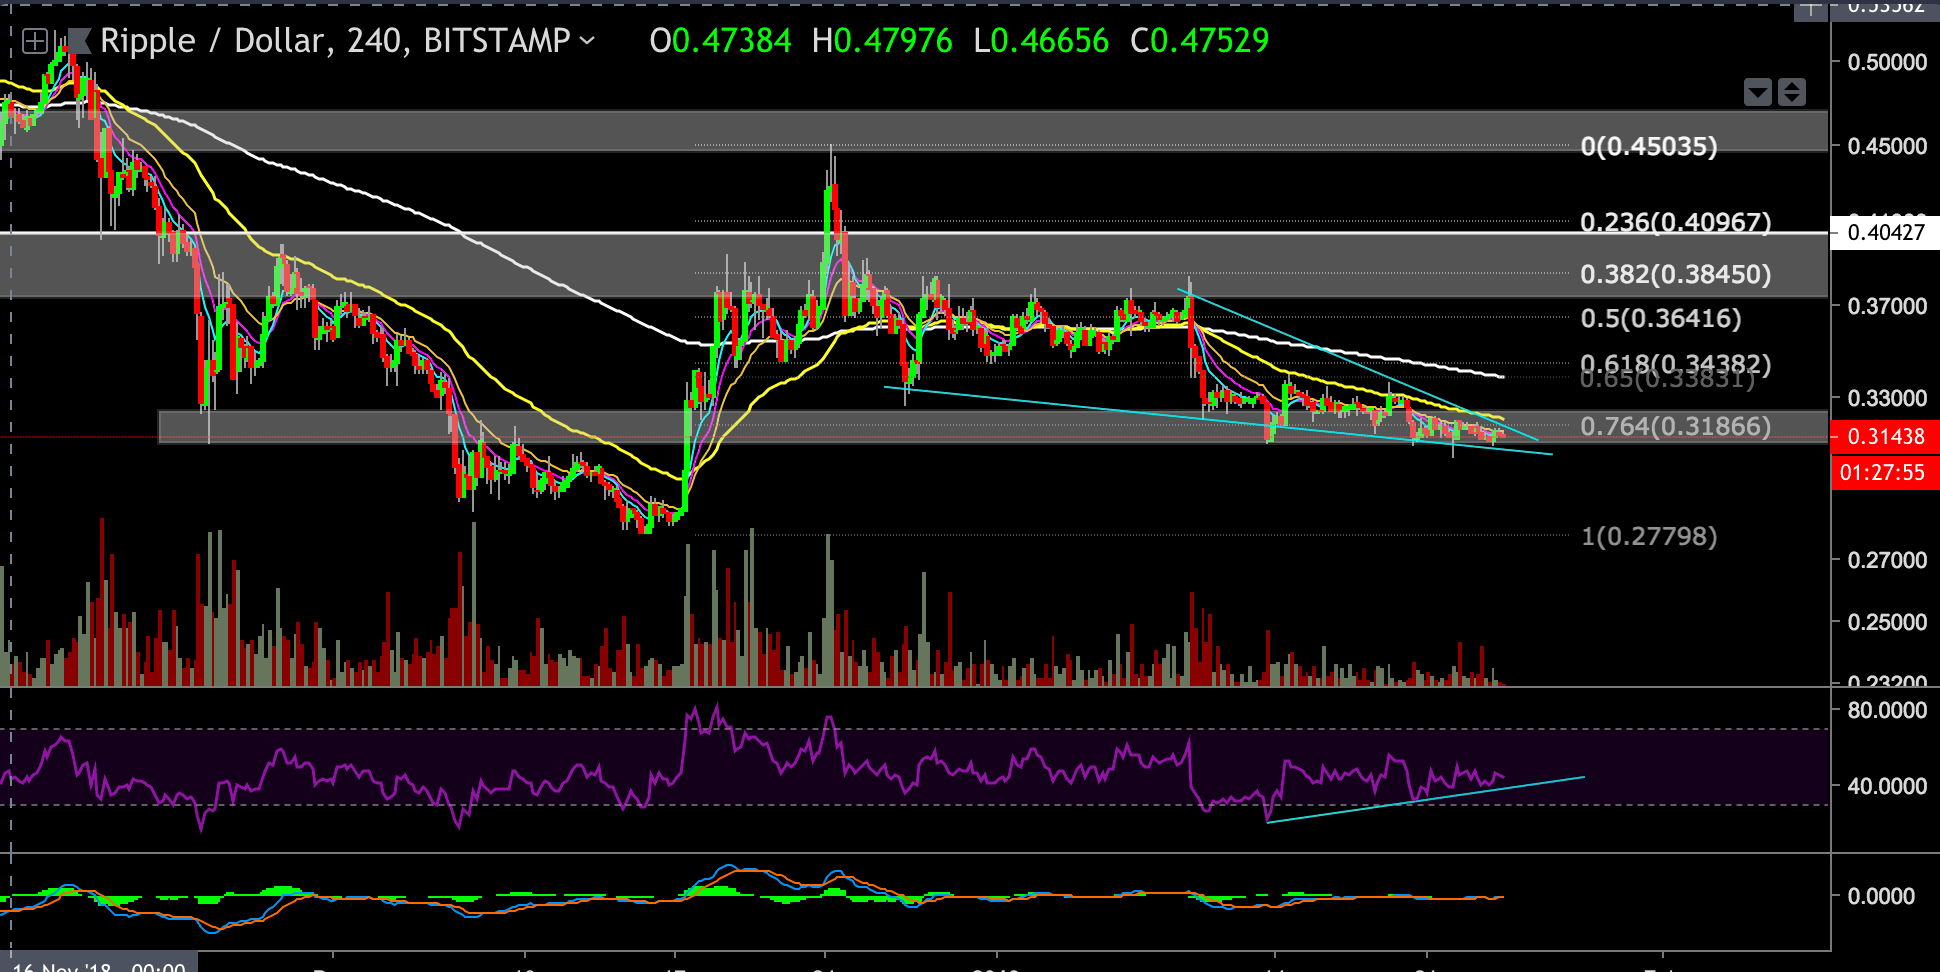
XRP is currently trading at the same levels as it did in our last analysis at the $0.31 price level.
This support level correlates with the 0.764 Fibonacci retracement level for XRP.
Looking at the 4-hour chart:
- At the time of writing, this post the XRP price is testing the $0.31 support level.
- A break of this support zone could send the XRP price is down towards the $0.2935 level or even lower at the $0.277 support level ( same targets as in our last analysis).
- From the bullish side, if the current support level holds and BTC chart chooses the bullish scenario, then the XRP price could rally toward the $0.35 or $0.37-$0.4 resistance level, as a starter.
- There is a descending diagonal formation that you can see on the 4-hour chart. Those types of formations are usually acting as a reversal formation with a bullish outcome, but in some cases, they work the other way around.
- Take into consideration that it might break, blow, and jump back up and create a hammer candle in order to catch the stop loss orders, and then move upward.
- RSI is holding the blue support trend line at the moment
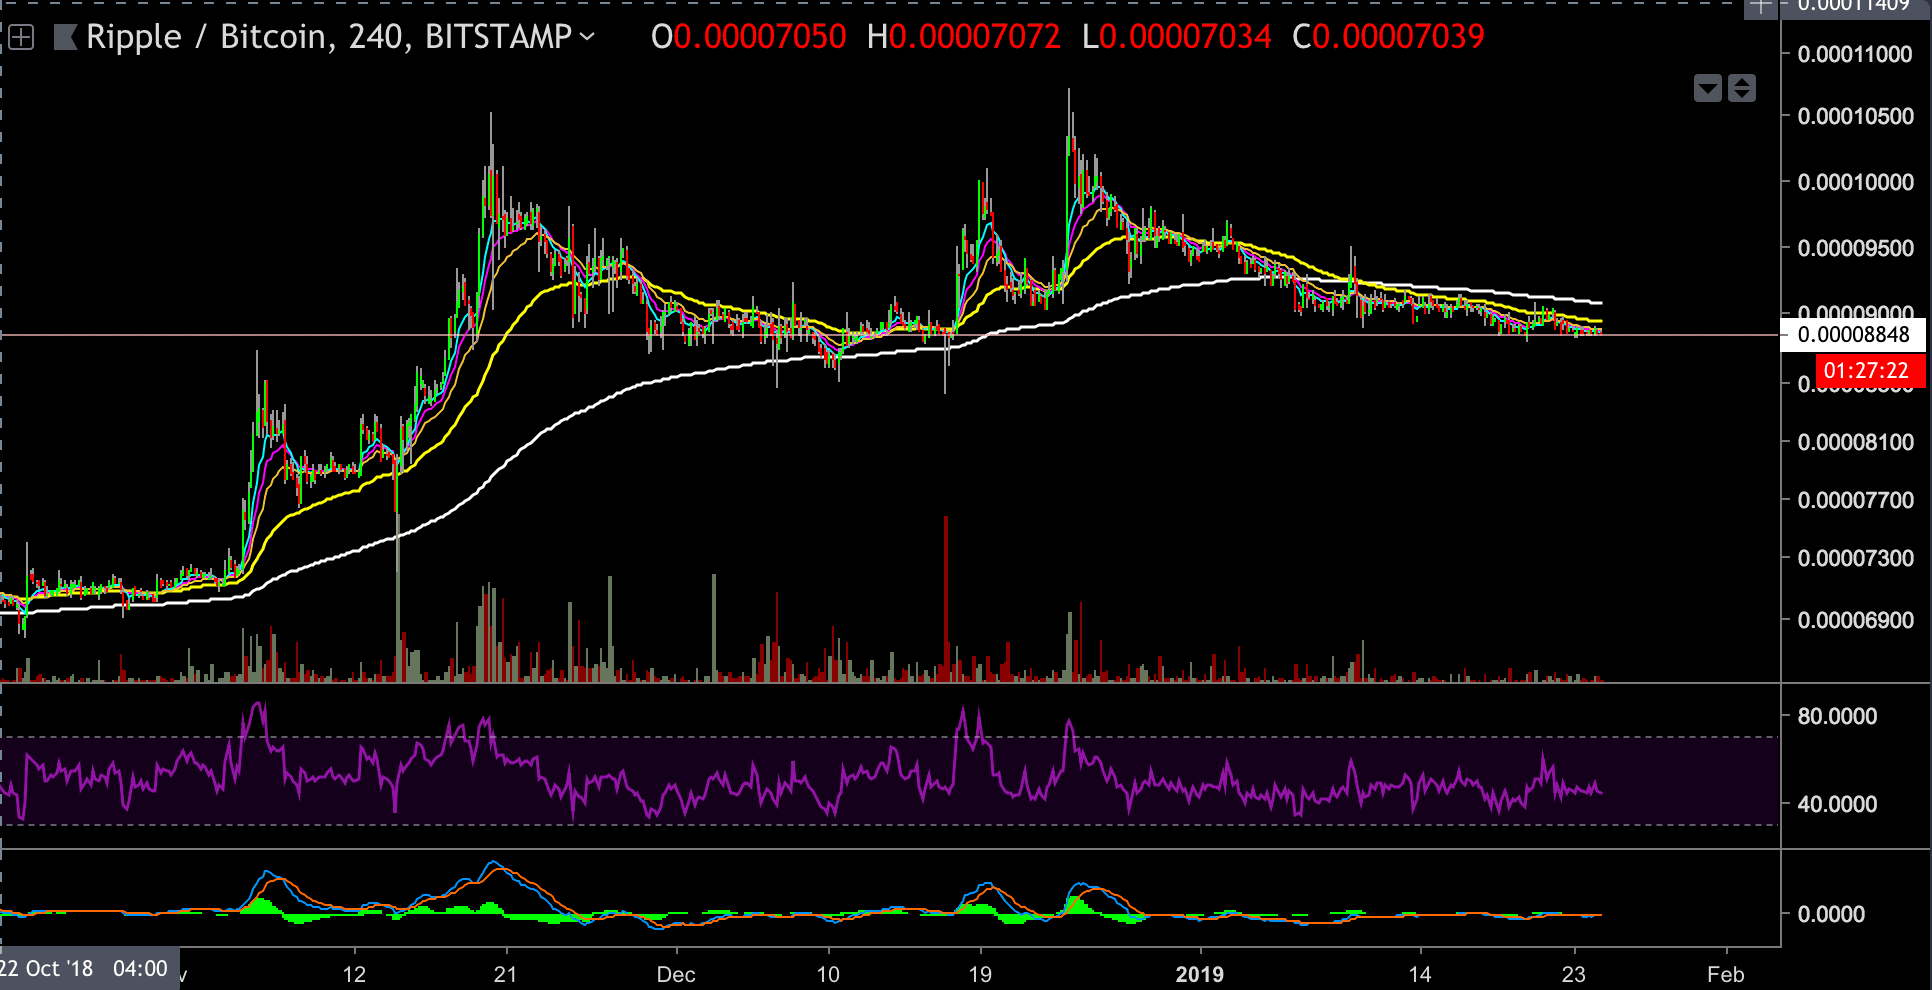
Looking at the XRP-BTC 4-hour chart
XRP is in a very important support zone, and if it breaks below it could trigger a strong bearish move or vice versa.
The post Ripple Price Analysis Jan.24: Waiting For The Next Move appeared first on CryptoPotato.

