Ripple Price Analysis: Is XRP on the Verge of Exploding to $0.68?
Although Ripple’s bullish momentum may have temporarily slowed down, recent price action hints that this might be about to change.
Nevertheless, it’s important to take a look at a few technical indicators to try and understand whether a correction is brewing or if XRP is on the verge of its next impulsive rally.
XRP Analysis
By Shayan
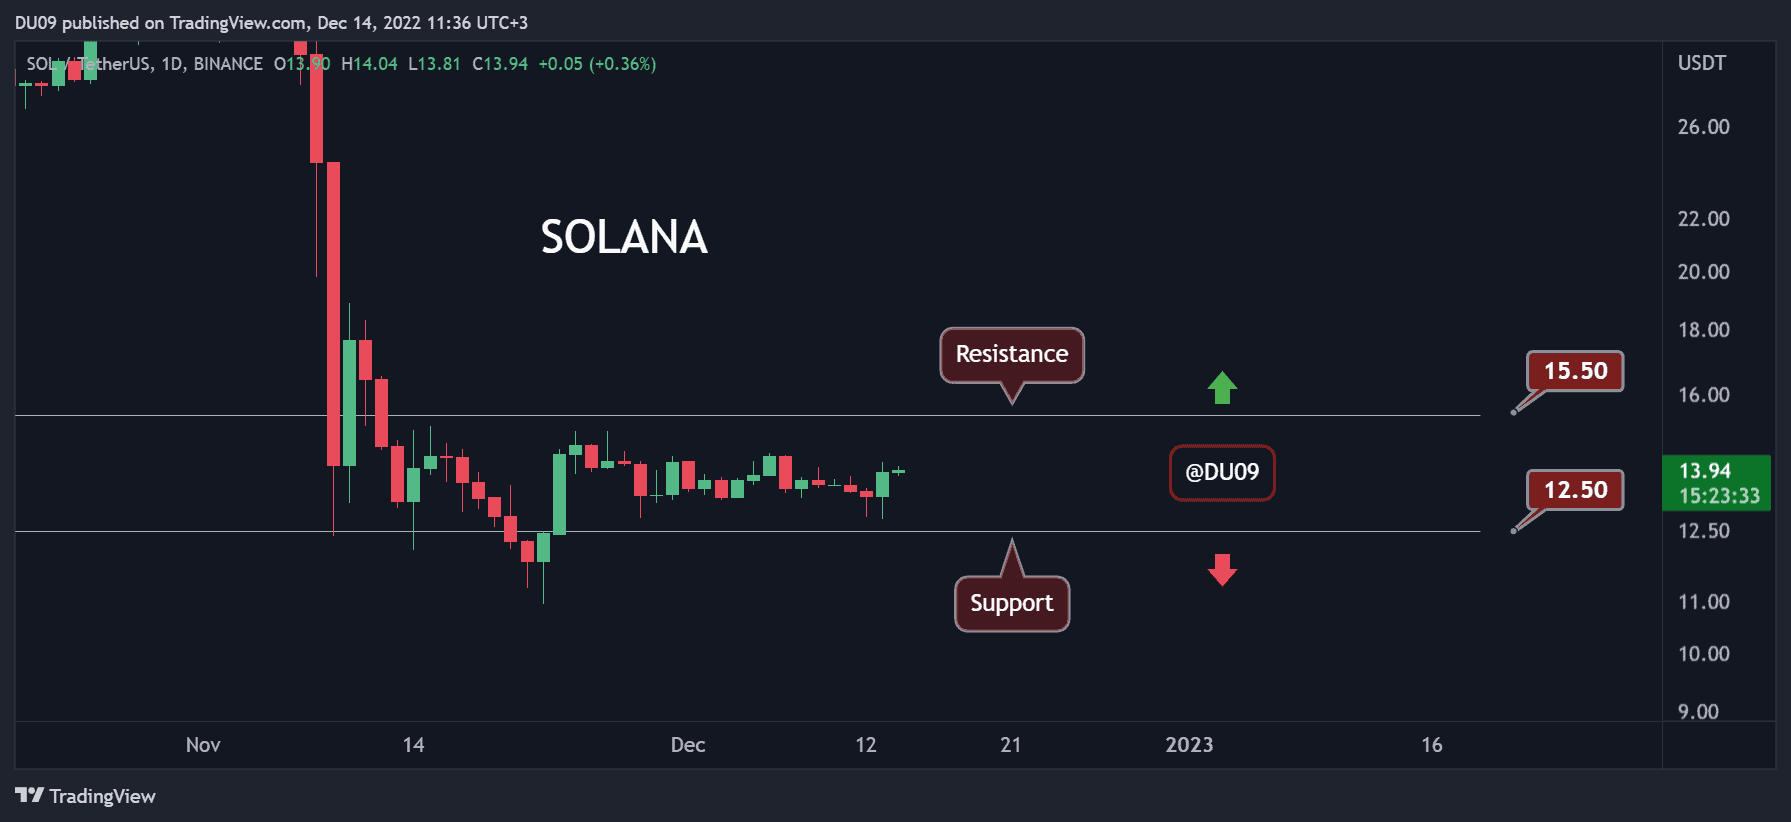
The Daily Chart
An in-depth examination of the daily chart reveals that after completing a pullback to the broken 200-day moving average at $0.54, Ripple found sufficient buying pressure, leading to a rally toward the critical $0.64 resistance. This crucial mark aligns with the price’s prior major swing high, serving as a significant barrier to buyers.
If the bulls manage to breach this pivot, continuing the positive trend toward the $0.7440 yearly high will become imminent, with Ripple buyers aiming to mark a new high.
However, considering the potential supply near this juncture and the slight bearish divergence between the price and the RSI indicator, a temporary corrective retracement stage is still on the table, with the price potentially consolidating within the $0.55-$0.64 significant range.

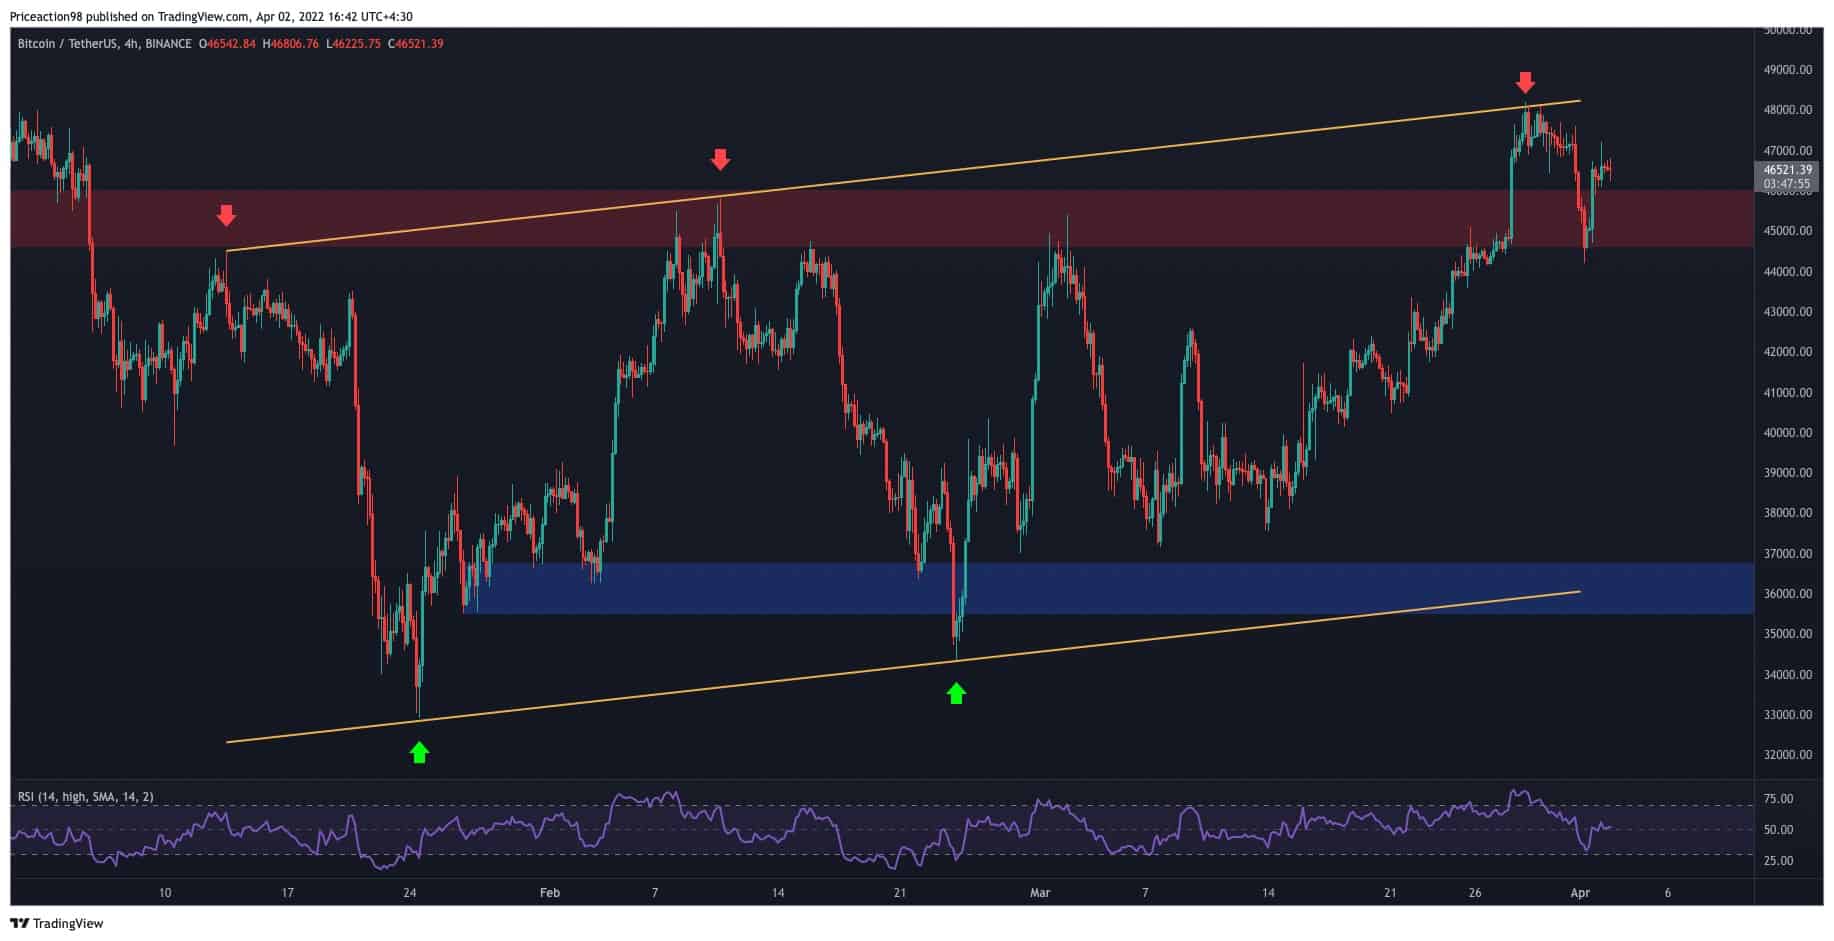
The 4-Hour Chart
Analyzing the 4-hour chart, it is evident that Ripple’s bullish momentum was met with notable selling pressure upon reaching the crucial $0.64 resistance region, leading to upward consolidation and forming an ascending wedge pattern.
The price is now at the narrowest range of the wedge pattern, with a breakout imminent.
Nevertheless, considering the bearish divergence between the price and the RSI indicator on the 4-hour timeframe and the potential supply near the $0.64 mark, a slight rejection followed by a short-term consolidation correction stage seems more plausible. If the price breaches the wedge’s lower boundary, a plummet toward the $0.55 threshold will be possible.
Yet, in the case of a more sustained corrective stage, the following potential targets for Ripple will be the 0.5 ($0.5) and 0.618 ($0.47) Fibonacci levels.

The post Ripple Price Analysis: Is XRP on the Verge of Exploding to $0.68? appeared first on CryptoPotato.