Ripple Price Analysis: Is XRP Headed to a Crash Below $0.50?
Ripple has recently encountered significant selling pressure near the $0.65 resistance zone, triggering a sharp decline.
This movement signals a potential shift toward bearish dominance as the price breaks below the ascending wedge pattern’s lower boundary. XRP may continue its descent toward the $0.5 threshold in the coming sessions.
XRP Analysis
By Shayan
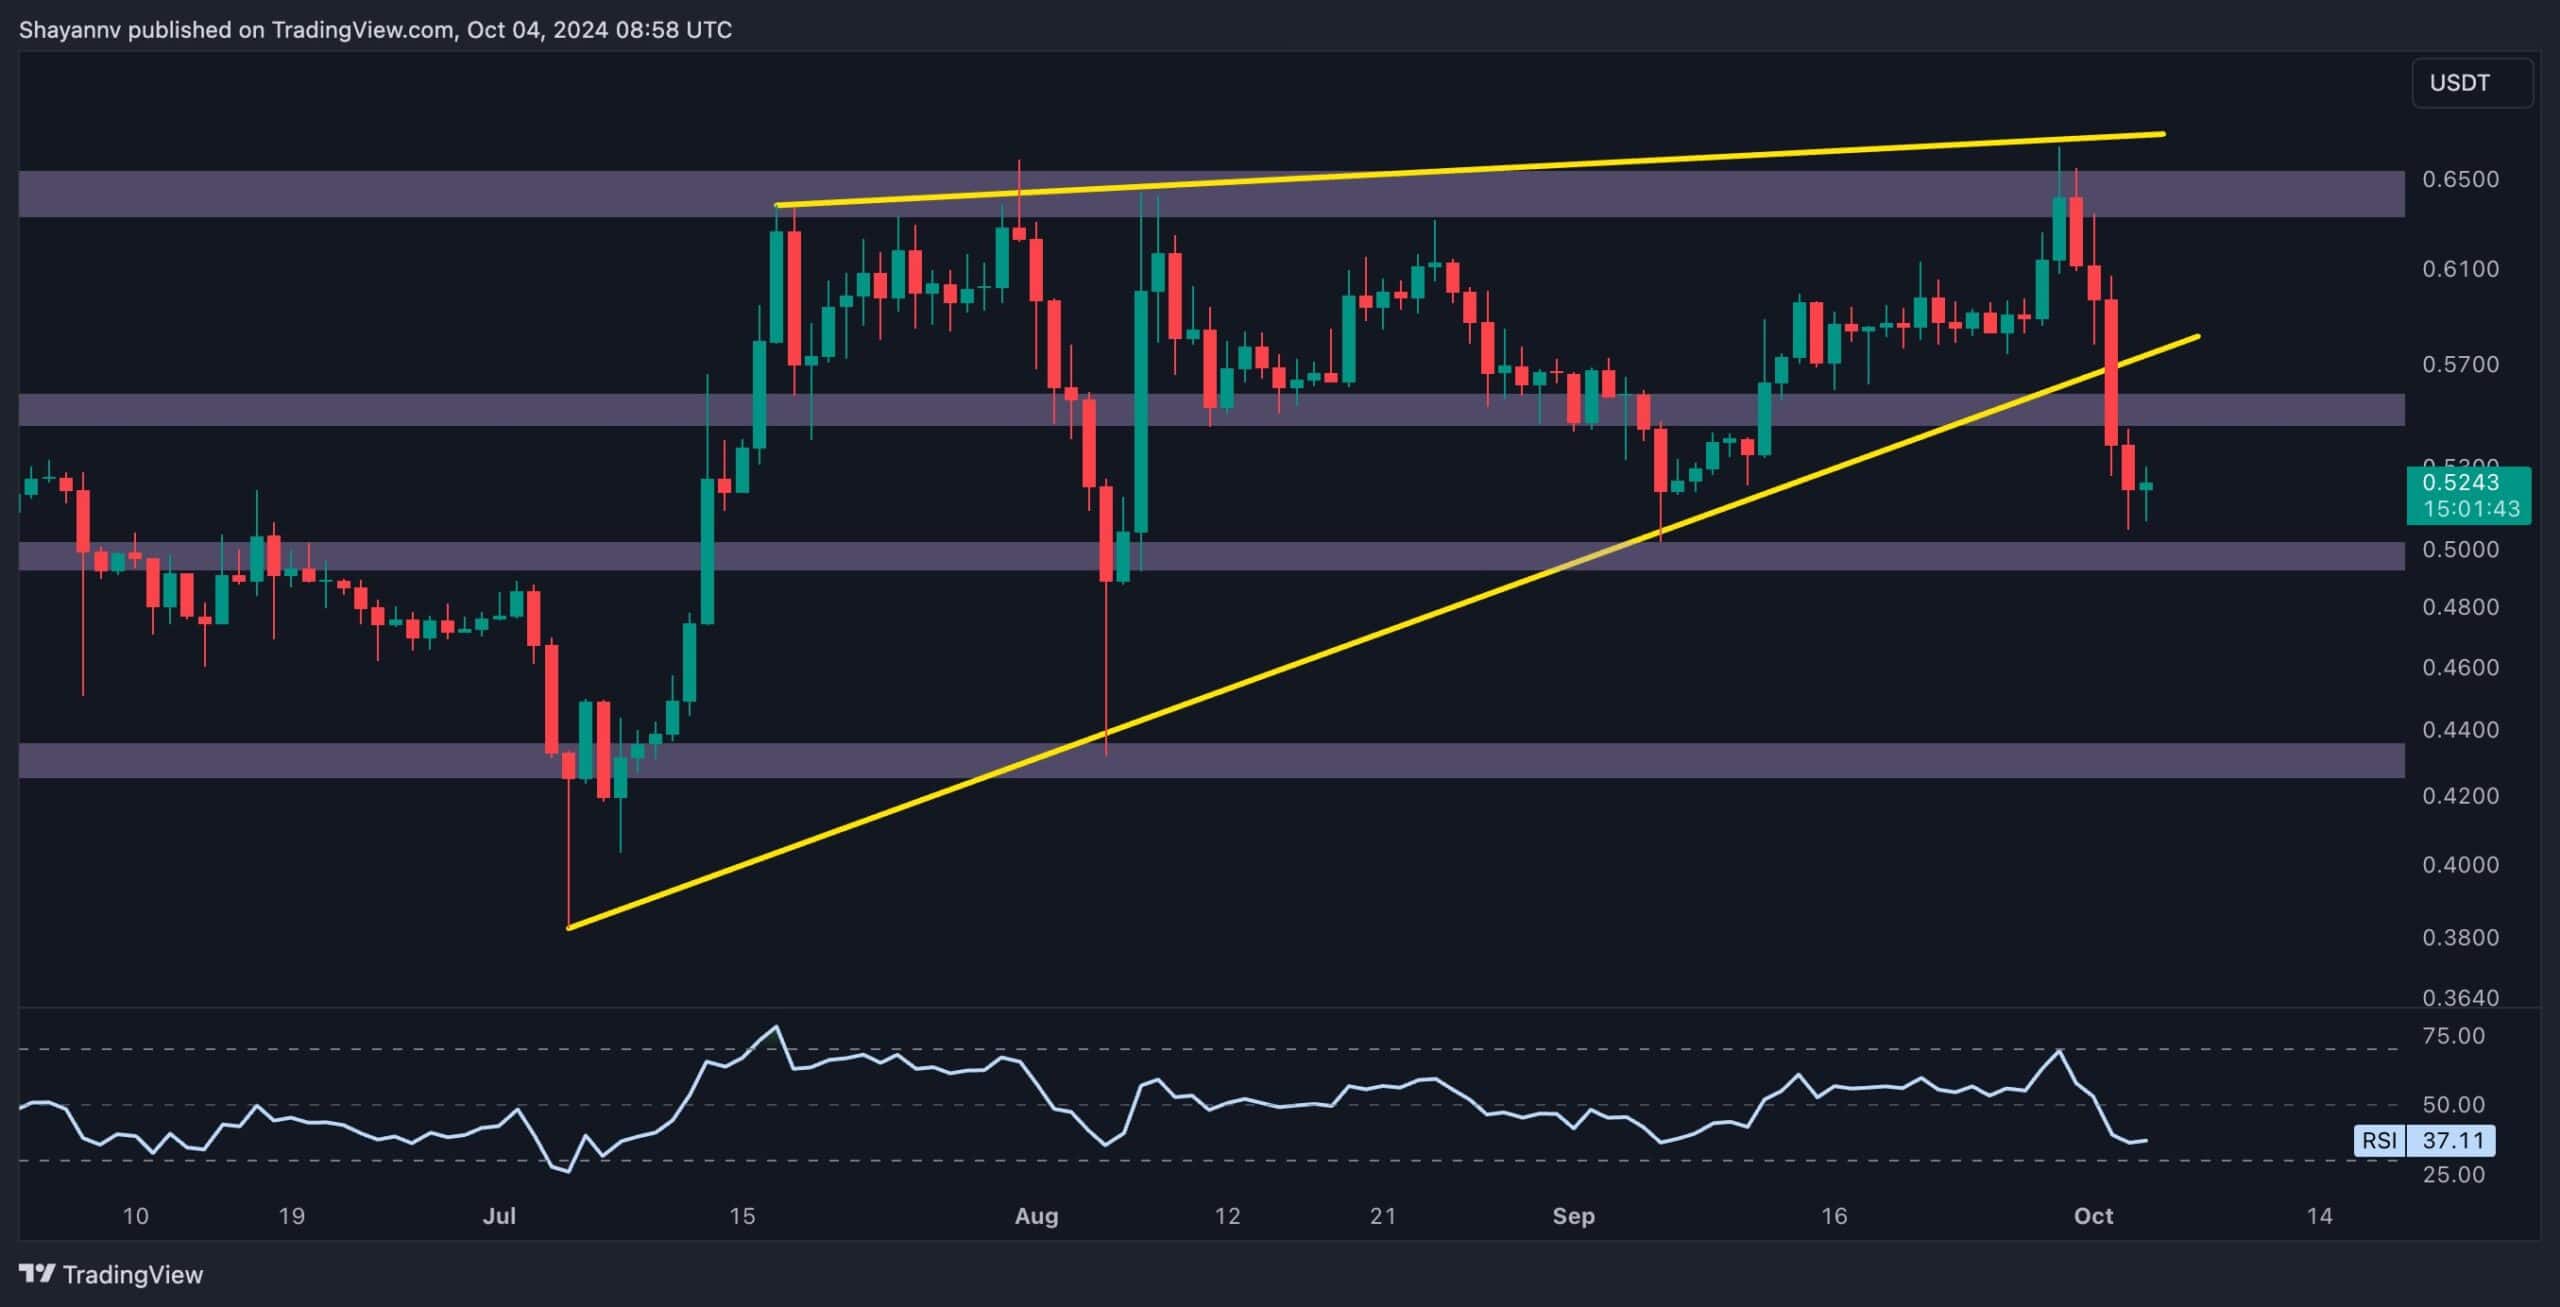
The Daily Chart
On the daily chart, XRP surged towards the ascending wedge’s upper boundary and the primary resistance zone of $0.65, only to face substantial rejection.
This area, aligning with previous swing highs, is a formidable resistance level and has halted further price increases in recent months. Following the rejection, Ripple entered the crucial price range of $0.5-$0.55, where short-term consolidation is likely to occur.
Given the break below the ascending wedge’s lower trendline, a bearish continuation is expected. If XRP attempts a pullback to retest the broken wedge, the price could face more selling pressure, potentially driving it toward lower thresholds, particularly the $0.5 support level.
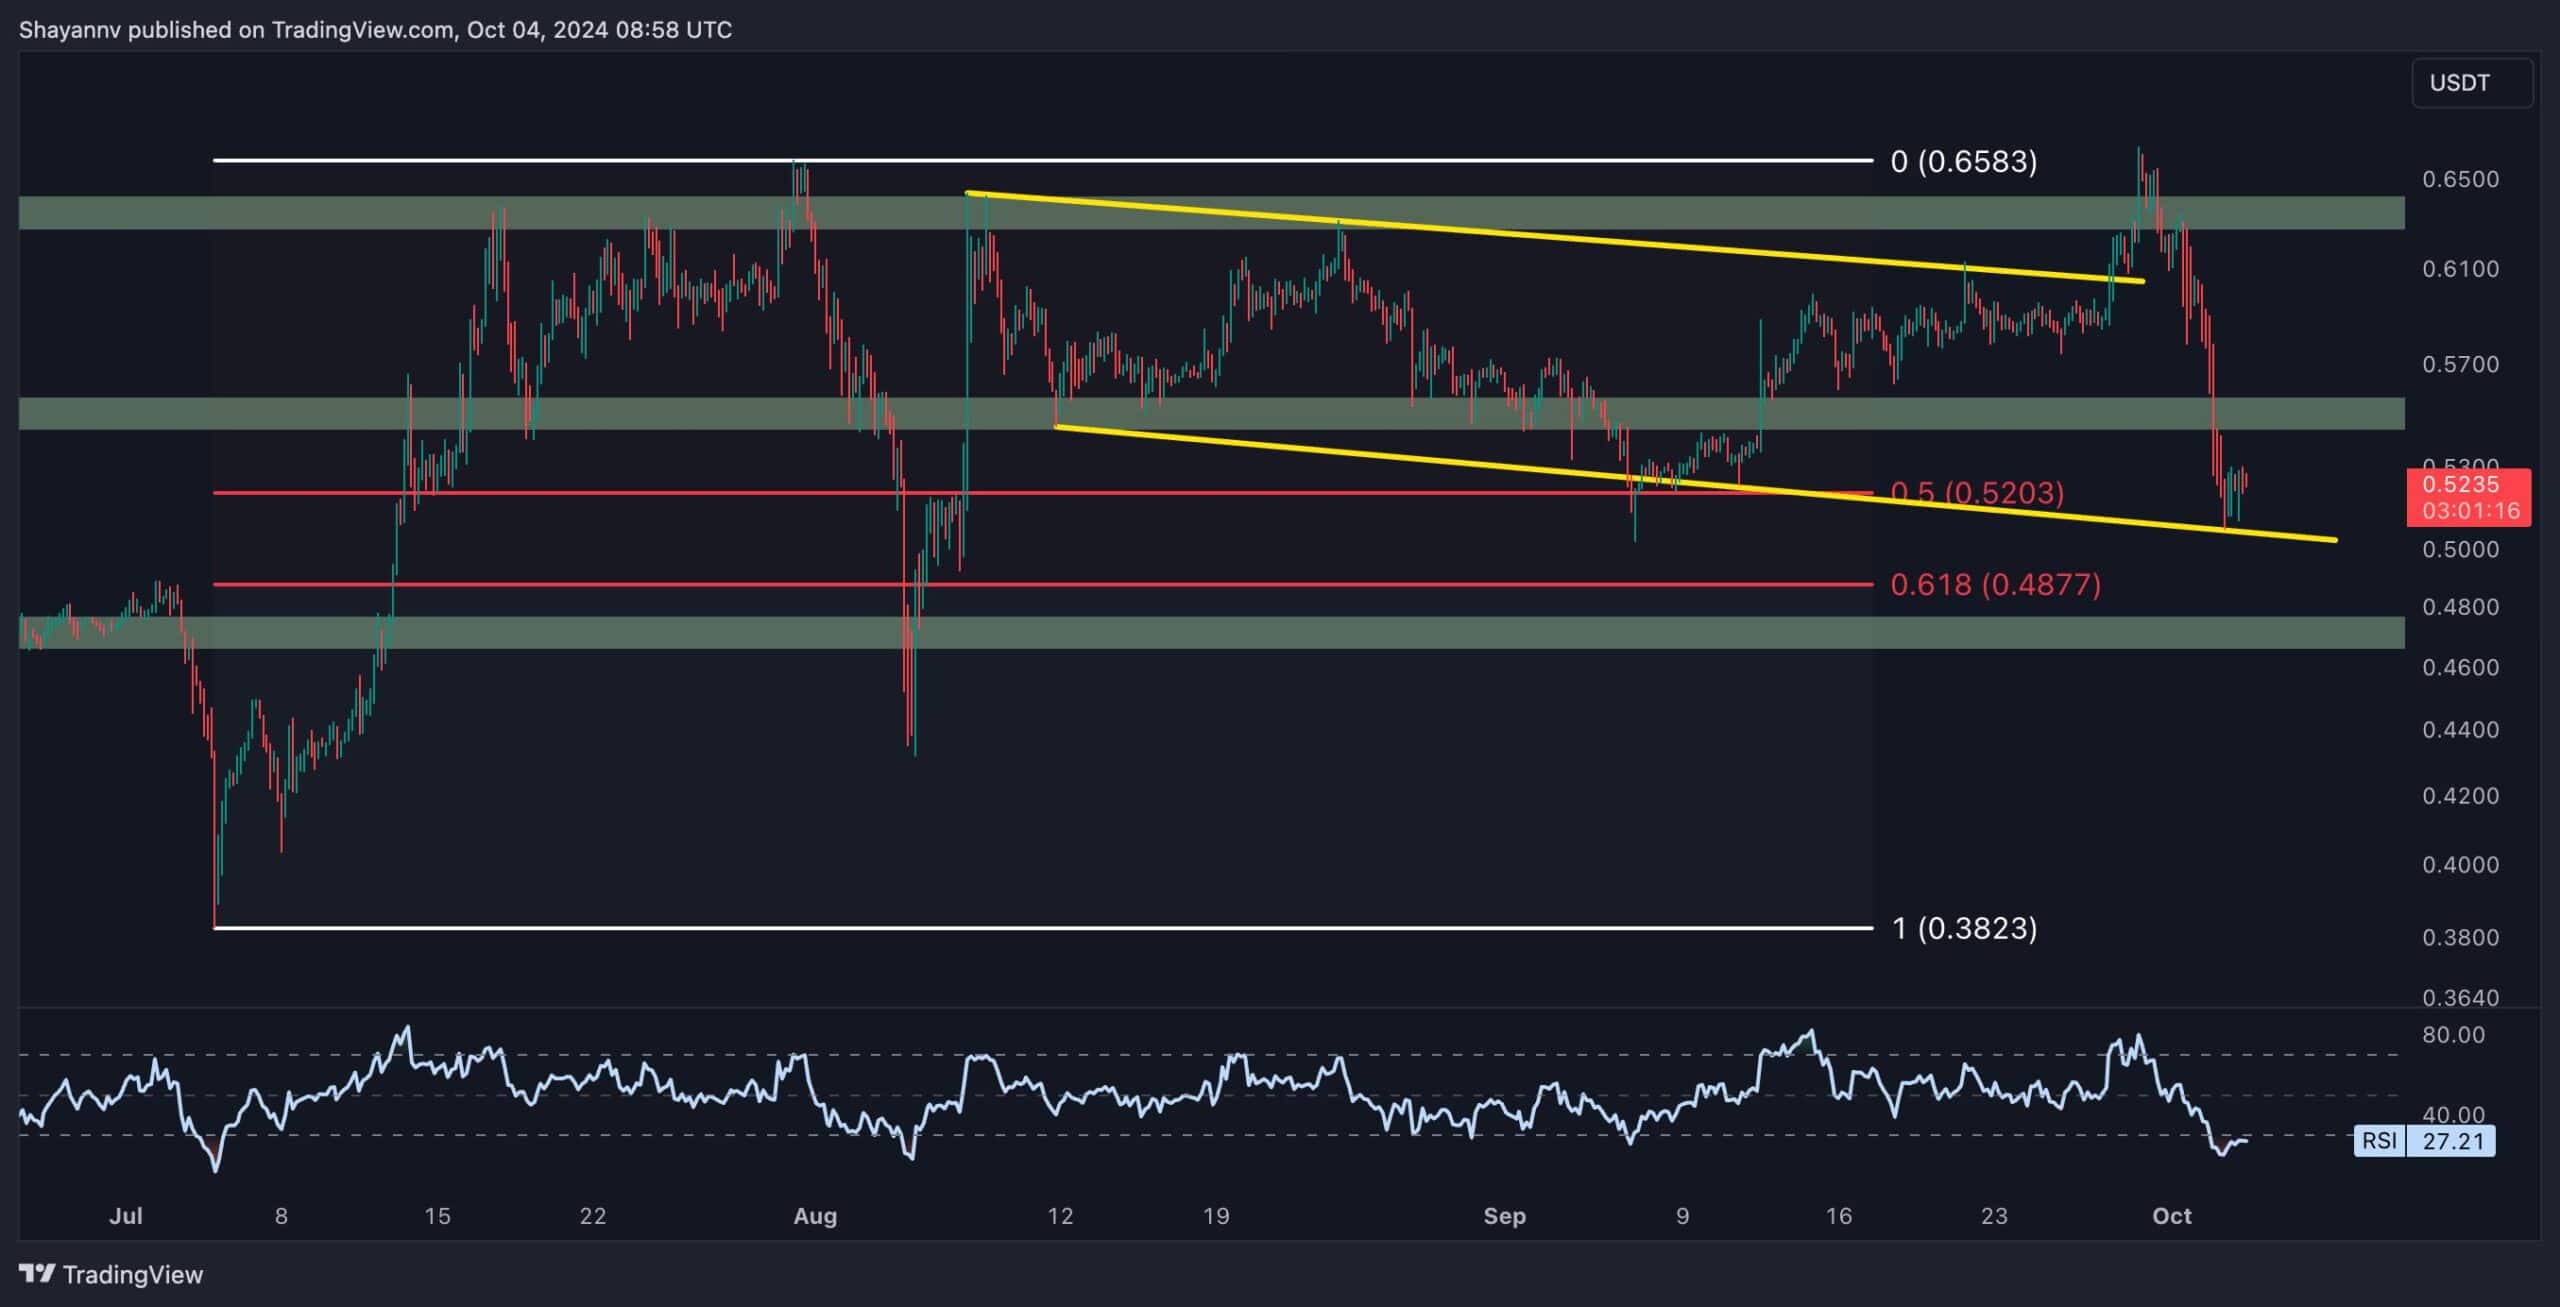
The 4-Hour Chart
The 4-hour chart reveals a false breakout after Ripple briefly surpassed the $0.65 level. This move brought in substantial demand, but the surge was met with intense selling pressure, leading to a sharp reversal.
XRP’s price quickly fell back inside the flag pattern from which it had broken out.
Currently, the cryptocurrency is testing a critical support region marked by the flag’s lower trendline and the Fibonacci retracement levels of 0.5 ($0.52) and 0.618 ($0.48). This range is expected to hold the price temporarily, leading to a potential short-term bullish corrective move and sideways consolidation before the next major trend direction is established.
The post Ripple Price Analysis: Is XRP Headed to a Crash Below $0.50? appeared first on CryptoPotato.