Ripple Price Analysis: Is XRP Headed for a Drop to $0.5?
Ripple’s price has recently experienced a significant decline, just as market participants were becoming optimistic about the beginning of a new bullish run.
By Edris Derakhshi (TradingRage)
The USDT Paired Chart
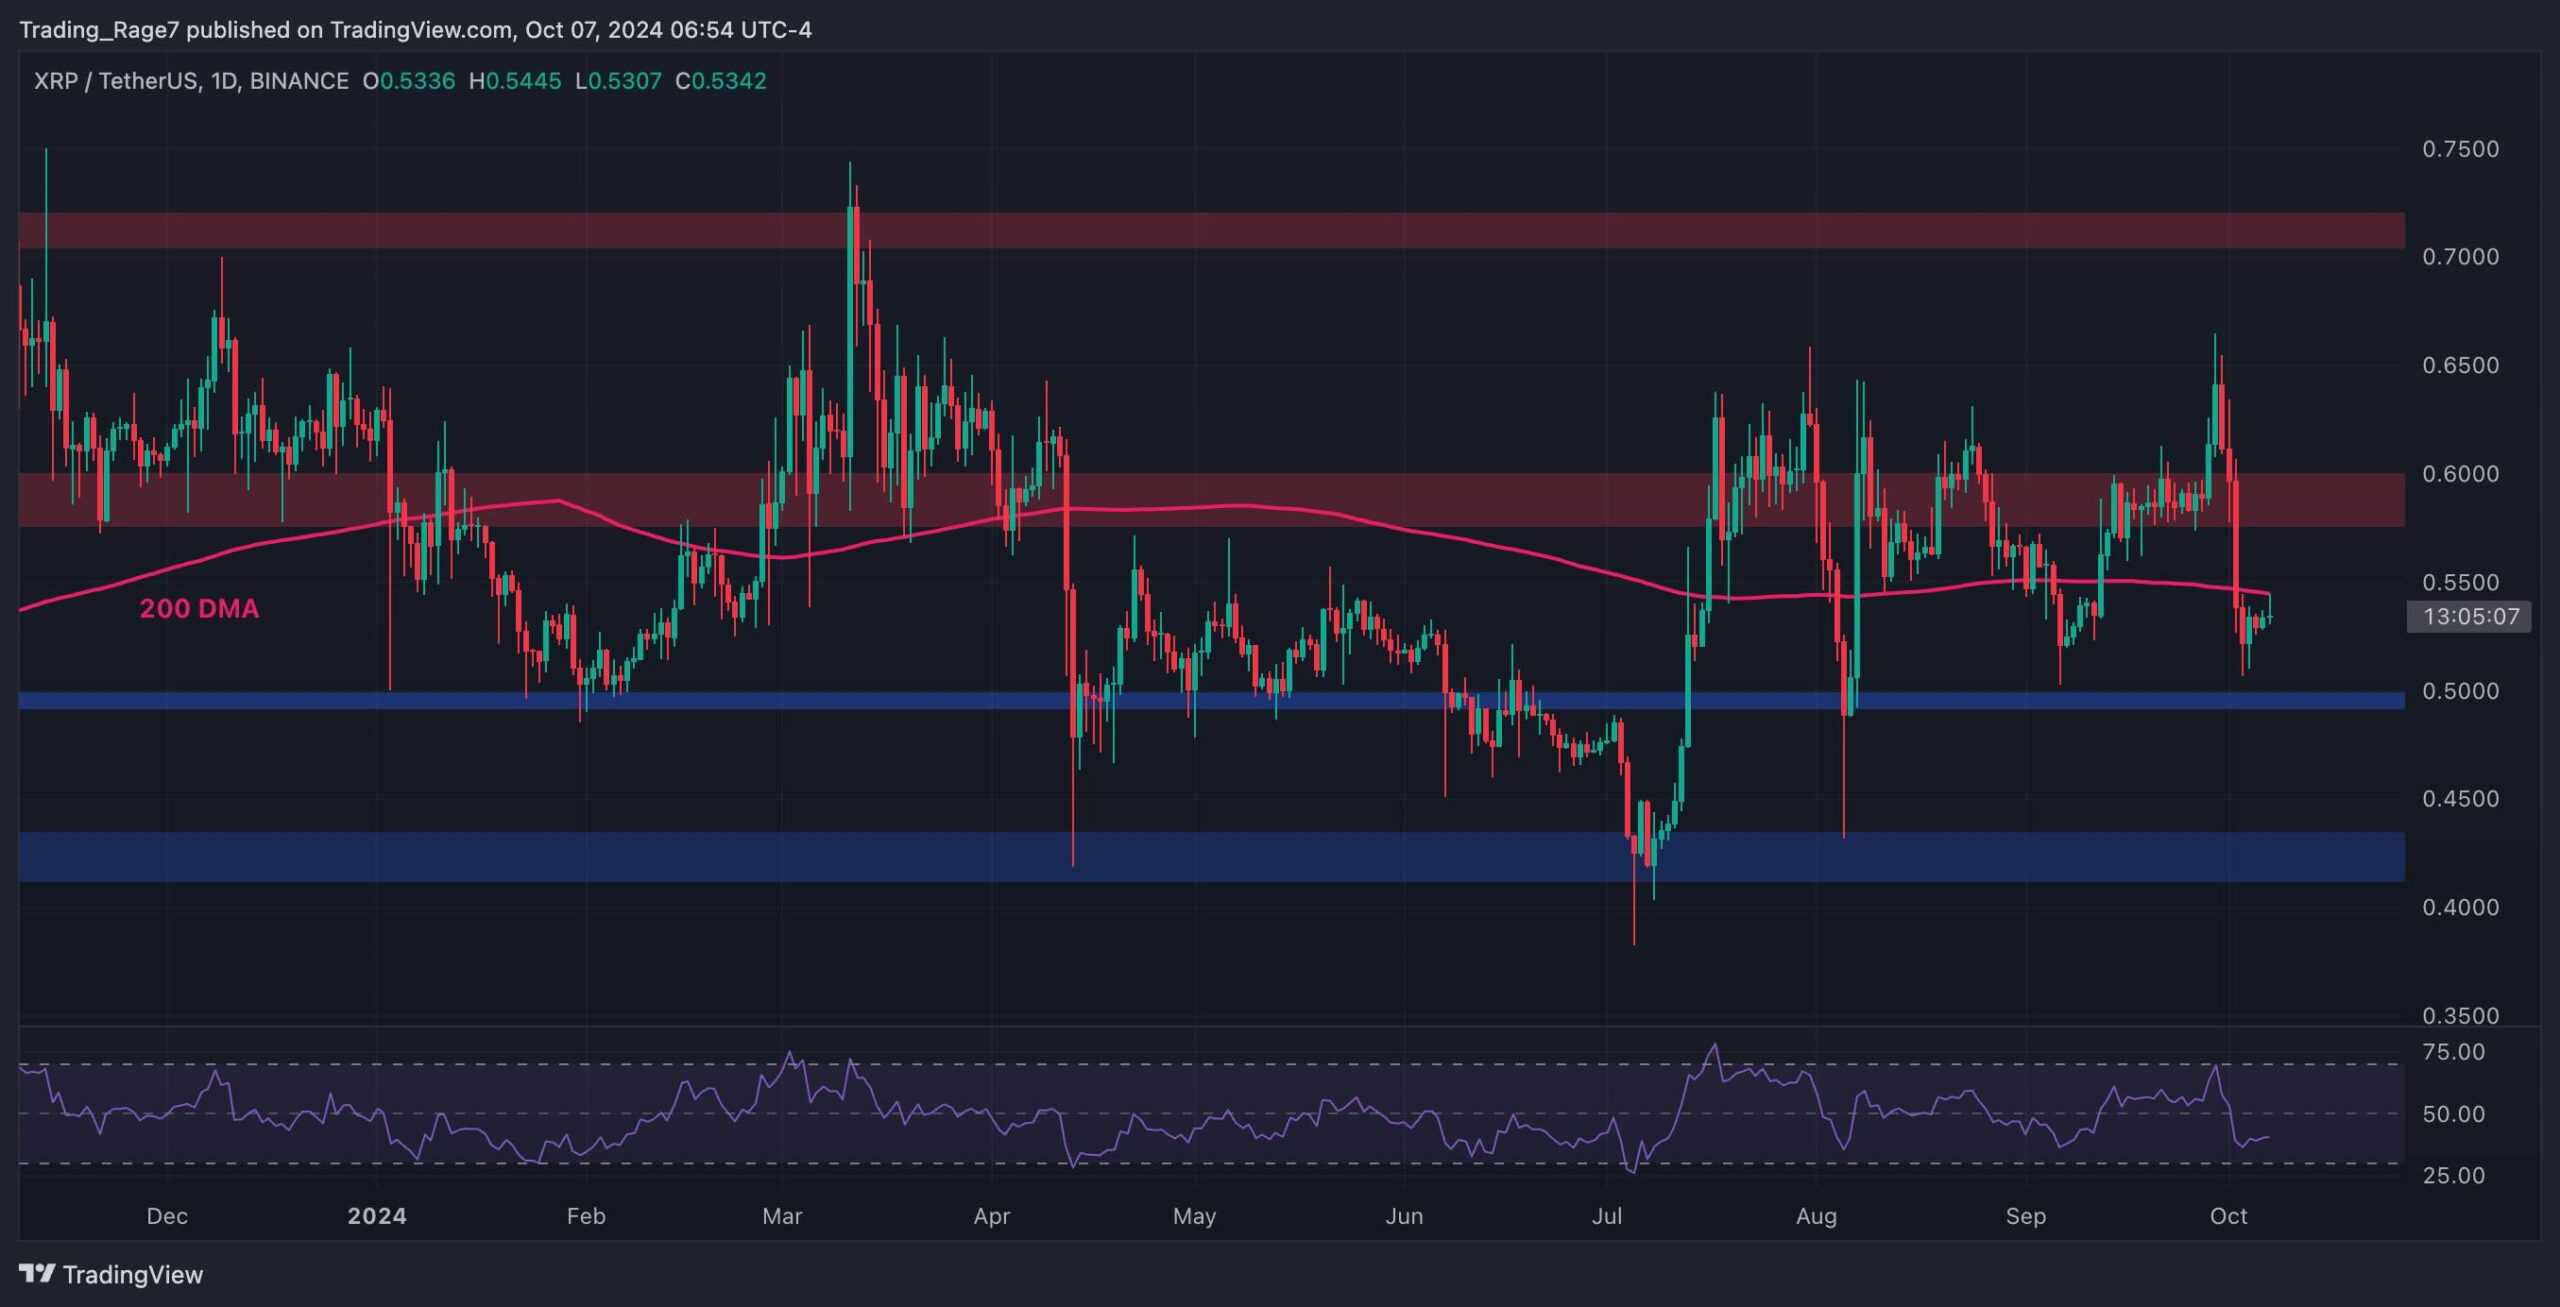
Against USDT, the XRP price broke above the $0.6 resistance level last week. Unfortunately,, it failed to hold above, and it crashed rapidly below the level and the 200-day moving average, located around the $0.55 mark.
The market has also failed to climb above the 200-day DMA, which is being rejected to the downside.
With the RSI also below 50%, the momentum is bearish, and a decline toward the $0.5 level is expected in the short term.
The BTC Paired Chart
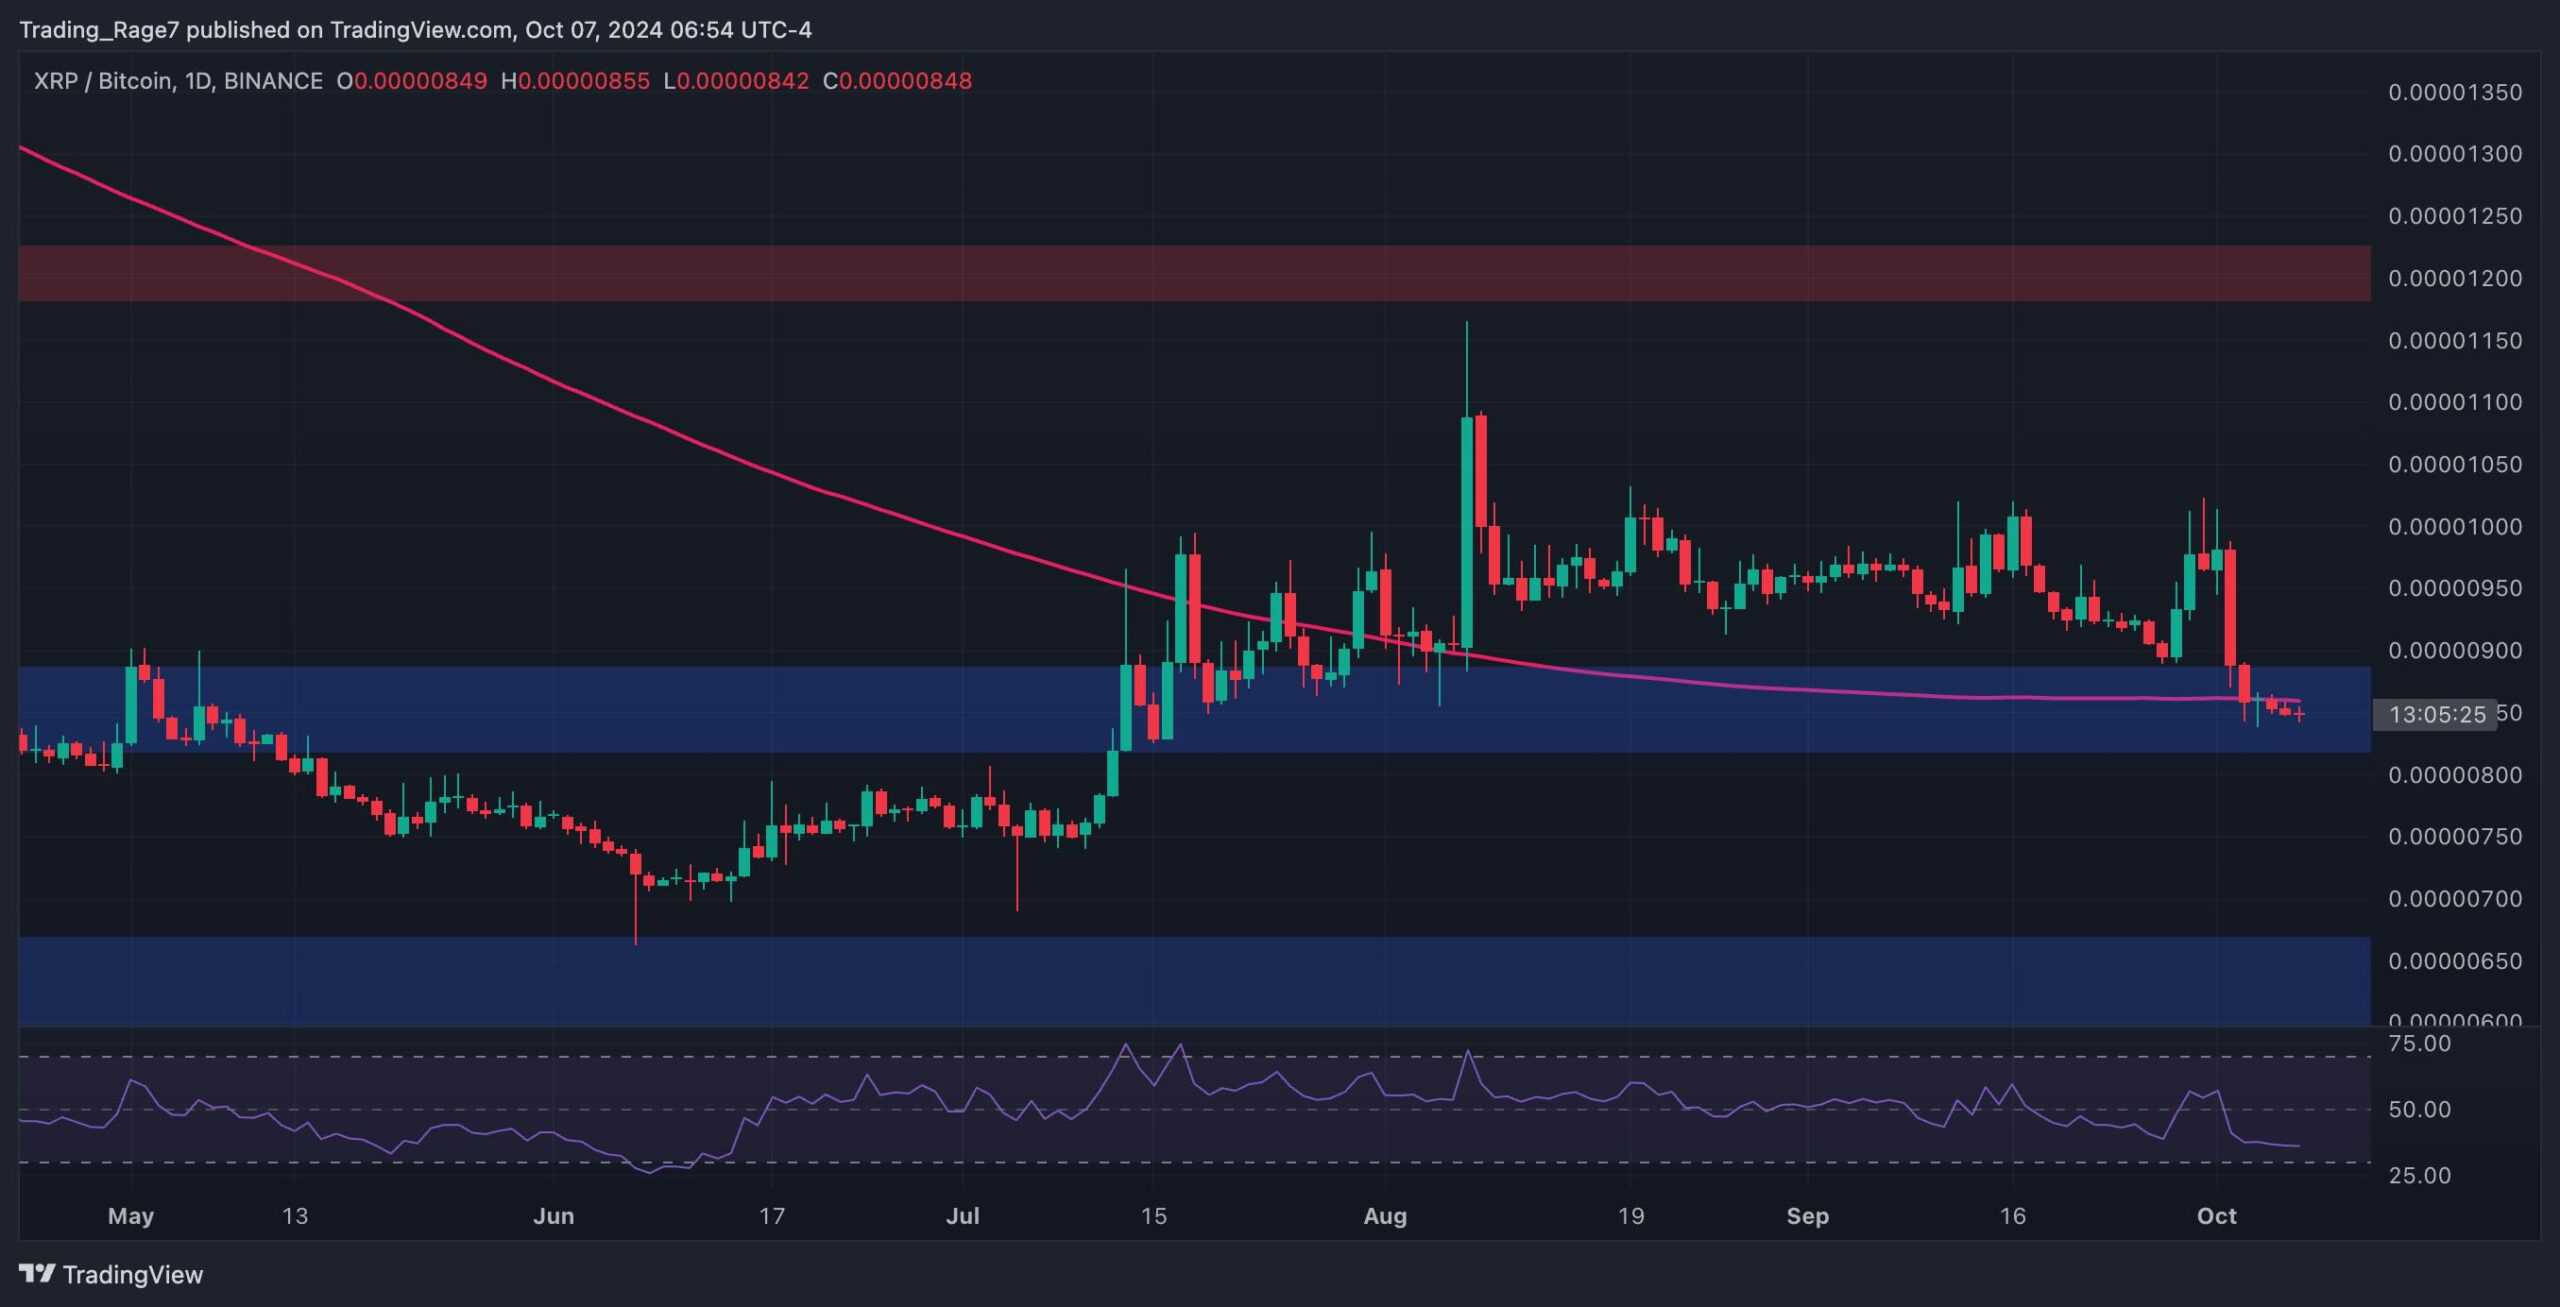
The XRP/BTC chart looks quite similar to the USDT pair. The market is gradually dropping below the 200-day moving average, around the 850 SAT mark.
If the 800 SAT level is also broken to the downside, a further downtrend toward the 600 SAT support zone is probable in the coming weeks.
With the RSI also showing bearishness in momentum, it seems likely that the market will plunge even further. However, things can quickly change if the 800 SAT level remains intact.
The post Ripple Price Analysis: Is XRP Headed for a Drop to $0.5? appeared first on CryptoPotato.